Insights on mobile data statistics for 2025 global trends, 5G growth, usage by region and demographics, plus telecom monetization strategies.
Table of contents
The world is racing toward a mobile-first reality. Data consumption isn’t just surging—it’s transforming economies, lifestyles, and industries.
In 2025, global mobile users are projected to surpass 7.49 billion. We are witnessing a data explosion that’s redefining telecom strategies, digital services, and revenue models.

Mobile data is powering modern connectivity, from ultra-HD streaming to IoT-driven smart cities.
This blog unpacks 2025’s mobile data statistics, exploring global usage trends, regional nuances, usage patterns, and their impact on telecom providers
Global Mobile Data Consumption Overview
Mobile data traffic is skyrocketing. This is being propelled by 5G’s rapid expansion, voracious content demand by the public, and a boom in data-intensive applications.
In 2025, the numbers are as follows:
- Global monthly mobile data usage is projected to reach approximately 200 exabytes in 2025 (excluding FWA – Fixed Wireless Access), according to current growth trends.
- The average smartphone user will consume 23 GB per month in 2025, up from 15 GB in 2022. This is driven by richer media formats and cloud services like Google Drive
- 5G networks are on their way to domination, they are projected to contribute 80% of total mobile traffic by 2030 with their capacity for high bandwidth use cases like 4K streaming and industrial IoT.
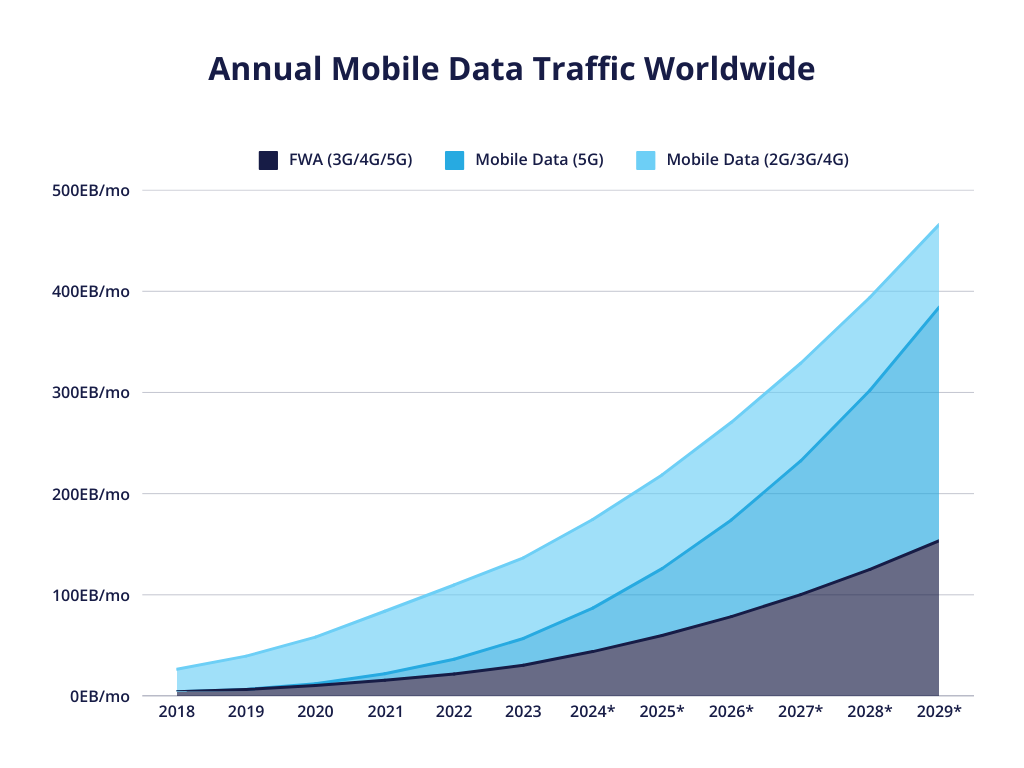
| Year | FWA (3G/4G/5G) | Mobile Data (5G) | Mobile Data (2G/3G/4G) |
|---|---|---|---|
| 2018 | 4.11 EB/mo | / | 22.42 EB/mo |
| 2019 | 6.39 EB/mo | 0.12 EB/mo | 32.88 EB/mo |
| 2020 | 10.35 EB/mo | 1.71 EB/mo | 46.15 EB/mo |
| 2021 | 15.56 EB/mo | 6.51 EB/mo | 61.68 EB/mo |
| 2022 | 21.69 EB/mo | 14.67 EB/mo | 73.37 EB/mo |
| 2023 | 30.40 EB/mo | 26.44 EB/mo | 79.76 EB/mo |
| 2024* | 43.89 EB/mo | 43.01 EB/mo | 87.58 EB/mo |
| 2025* | 59.74 EB/mo | 66.16 EB/mo | 92.60 EB/mo |
| 2026* | 78.50 EB/mo | 95.47 EB/mo | 96.53 EB/mo |
| 2027* | 100.23 EB/mo | 132.09 EB/mo | 96.57 EB/mo |
| 2028* | 125.10 EB/mo | 177.15 EB/mo | 91.84 EB/mo |
| 2029* | 153.55 EB/mo | 230.97 EB/mo | 81.64 EB/mo |
Source: Statista
The above surge in data isn’t just about scale- it’s about complexity.
Telecoms must process billions of microtransactions daily.
Micro-transactions include everything from Netflix binges to smart meter pings.
Picture this, a single 5G user streaming a live Premier League match in 4K can use 10 GB in an hour.
A pattern like this is repeated millions of times globally.
According to GSMA, the mobile technology industry contributed up to $6.5 trillion in 2024.
Mobile Data Usage by Quarter
Here’s a quick rundown of mobile data usage by quarter:

| Quarter | Mobile Data Usage |
|---|---|
| Q2’18 | 18.37 EB/month |
| Q3’18 | 21.78 EB/month |
| Q4’18 | 26.54 EB/month |
| Q1’19 | 29.02 EB/month |
| Q2’19 | 32.66 EB/month |
| Q3’19 | 36.49 EB/month |
| Q4’19 | 39.56 EB/month |
| Q1’20 | 45.16 EB/month |
| Q2’20 | 50.03 EB/month |
| Q3’20 | 54.79 EB/month |
| Q4’20 | 58.44 EB/month |
| Q1’21 | 66.14 EB/month |
| Q2’21 | 72.20 EB/month |
| Q3’21 | 77.81 EB/month |
| Q4’21 | 84.16 EB/month |
| Q1’22 | 89.32 EB/month |
| Q2’22 | 95.78 EB/month |
| Q3’22 | 103.31 EB/month |
| Q4’22 | 109.81 EB/month |
| Q1’23 | 116.04 EB/month |
| Q2’23 | 123.03 EB/month |
| Q3’23 | 130.15 EB/month |
| Q4’23 | 136.88 EB/month |
| Q1’24 | 144.53 EB/month |
| Q2’24 | 150.80 EB/month |
| Q3’24 | 157.16 EB/month |
Source: Ericsson Mobility Report (November 2024)
Mobile Data Statistics by Demographic
In 2025, data consumption isn’t just about geography.
It’s shaped by age, income, gender, and where people live.
And each group behaves differently.
Telecom aiming to boost ARPU need flexible monetization tools to adress these shifts.
Mobile Data Usage by Age Group
Younger users dominate mobile data usage.
Gen Z (18-24) lead with social media, video, and gaming.
Older adults lag due to lower digital literacy and device access.
Plans that adapt to life stages, not just device types, are critical.
What it means? Flexible, usage-based billing resonates with younger groups, while older users lean toward simpler, predictable plans.
Mobile Data Usage by Income Levels
In high-income markets, users stream freely and consume heavily – often on premium 5G plans.
In lower-income markets, affordability remains the blocker.
For women in LMICs (low and middle-income countries), a basic smartphone can cost up to 24% of monthly income, compared to 12% for men.
What it means? Micro-data packs, installment pjone plans, and inclusive pricing matter more than ever. Monetization models need to scale down as much as they scale up.
Mobile Data Usage in Urban vs. Rural Users
Urban users enjoy stronger networks and drive high data use, especially for video and gaming.
In rural areas 28% fewer adults use mobile internet.
Barriers like coverage and cost still hold many rural users back.
What it means? Rural users need low-cost, flat-rate options. Billing platforms must support region-sensitive offers, not just global bundles.
Mobile Data Usage in Enterprise vs. Consumer Segments
Enterprise traffic is growing – IoT, smart logistics, cloud tools.
These devices can generate 50+ GB/month.
Consumers, meanwhile, still account for most of the volume via streaming, chatting, and scrolling.
What it means? Monetization engines must handle both: per-event billing for machines and flexible plans for humans.
Mobile Data Usage by Gender Dynamics
Women in LMICs are 14% less likely than men to use mobile internet.
Causes? Cost, safety, literacy.
Men access more bandwidth, more often.
What it means? Family-sharing plans, low-cost devices, and safer onboarding flows aren’t just user features, they’re revenue unlocks.
Mobile data isn’t one-size-fits-all.
Telecoms need monetization tools that can flex across demographics, adapting plans in real-time.
Mobile Data Statistics by Region

| Region | 2024 Avg. | 2030 Avg. | CAGR (2024-30) |
|---|---|---|---|
| South Asia | 32 GB/mo | 66 GB/mo | 13% |
| Gulf Region | 29 GB/mo | 54 GB/mo | 11% |
| North America | 22 GB/mo | 52 GB/mo | 16% |
| Western Europe | 23 GB/mo | 49 GB/mo | 14% |
| Central/Eastern Europe | 20 GB/mo | 42 GB/mo | 14% |
| Middle East & North Africa | 19 GB/mo | 43 GB/mo | 15% |
| South East Asia & Oceania | 19 GB/mo | 39 GB/mo | 13% |
| Global | 19 GB/mo | 40 GB/mo | 13% |
| North East Asia | 21 GB/mo | 38 GB/mo | 11% |
| Latin America | 13 GB/mo | 34 GB/mo | 18% |
| Sub-Saharan Africa | 5.4 GB/mo | 17 GB/mo | 21% |
Source: Ericsson Mobility Report (November 2024)
South Asia (India, Nepal, Bhutan)
South Asia is experiencing rapid growth in mobile data usage.
India is leading this surge, driven by affordable 4G plans and increasing smartphone penetration.
5G subscriptions in India are projected to reach 74% of total mobile subscriptions by 2030.
Gulf Cooperation Council (GCC)
The GCC countries are set to have the highest 5G penetration globally.
It’s projected to reach 93% by 2030.
This rapid adoption is fueling increased data consumption, supported by strong consumer purchasing power and advanced digital infrastructure.
North America
North America’s data usage is driven by high adoption of streaming services and cloud gaming.
The region’s mobile data traffic is expected to triple by 2030.
This highlights the need for more robust infrastructure and flexible billing solutions.
Western Europe
Western Europe’s data consumption is steadily increasing.
Their focus is mostly on streaming and remote work applications.
The region is also seeing significant investments in 5G infrastructure.
Central & Eastern Europe
Central and Eastern Europe are witnessing consistent growth in mobile data usage.
Their 4G and 5G networks are expanding as well.
Scalable billing systems are needed to accommodate increasing demand.
Middle East & North Africa (MENA)
MENA’s mobile data usage is on the rise.
5G is expected to account for 60% of total subscriptions by 2030.
Digital transformation in the region is accelerated by economic diversification and investments in advanced mobile tech.
South East Asia & Oceania
Growth in mobile data consumption in this region is steady.
Smartphone adoption is increasing and 5G coverage is expanding.
Countries like Australia are leading in data usage, with growing demand for high-speed connectivity.
Global Average
Globally, mobile data usage is expected to more than double by 2030.
Telecoms need flexible and scalable billing to manage this growth.
North East Asia (Including China)
China is a leader in mobile data consumption, with its extensive 5G infrastructure and a high number of IoT devices.
Their state-led infrastructure and digital systems are a key driver of this growth.
Apps like WeChat blend social media, payments, and services, consuming a substantial amount of data in the process.
Latin America (LATAM)
Latin America’s mobile data usage is set to grow rapidly.
Increased smartphone penetration and expansion of 4G and 5G infrastructure are key drivers of this growth.
Telcos have amazing opportunities to introduce innovative billing models in this region.
Sub-Saharan Africa
Sub-Saharan Africa has the highest projected growth rate in mobile data usage (21%).
However, challenges such as digital literacy and infrastructure development remain critical to address.
Notable Regional Nuances:
- Africa: M-Pesa makes banking a top driver.
- Asia: Huge focus on gaming.
- Middle East: AR/VR shopping apps, tied to Dubai’s malls, consume 2 GB/hour, per Ericsson.
- China: Super-apps (WeChat, Alipay) merge activities, with 70% of users spending 2+ hours daily.
Mobile Data Usage Statistics by Activity
Mobile data usage reflects people’s daily habits. Globally, users are spending up to 4.5 hours on their devices.
The table below shows how activities stack up in 2025:

| Activity | Data Usage | Percentage Share |
|---|---|---|
| Video Applications | 111.45 EB/mo | 75.9% |
| Other Apps | 15.4 EB/mo | 10.5% |
| Social Networking | 11.52 EB/mo | 7.8% |
| Software Updates | 4.01 EB/mo | 2.7% |
| Web Browsing | 2.09 EB/mo | 1.4% |
| Audio Applications | 1.76 EB/mo | 1.2% |
| File Sharing | 0.69 EB/mo | 0.5% |
Mobile Data Usage by Activity
Video Applications (75.9% – 111.45 EB/mo):
Streaming is the heavyweight here.
Youtube, Netflix, TikTok are pulling a substantial share.
A single hour of 4K streaming eats up 7-10GB on a stable 5G connection.
In the US, over 60% of users stream daily.
Live sports? They spike usage by 20% alone.
Other Apps (10.5% – 15.4 EB/mo):
This includes everything from messaging tools to utilities.
Often overlooked, but still a significant chunk.
Social Networking (7.8% – 11.52 EB/mo):
Instagram, TikTok, WhatsApp, and more.
Short videos and non-stop scrolling burn serious bandwidth.
In India, 40% of youth data goes to Instagram Reels alone.
WhatsApp video calls? Around 0.5GB/hour globally.
Software Updates (2.7% – 4.01 EB/mo):
Automatic OS and app updates in the background.
Quiet, but steady data consumers.
Web Browsing (1.4% – 2.09 EB/mo):
Still relevant, but no longer the main act.
Standard browsing uses ~150-250 MB/hour.
Audio Applications (1.2% – 1.76 EB/mo):
Music apps like Spotify and podcasts use much less, around 40-150 MB/hour.
Great for long sessions, low data impact.
File Sharing (0.5% – 0.69 EB/mo):
Niche but necessary.
Sending videos, documents, and heavy media files takes up more than you might think.
Source: Ericsson Mobility Report (November 2024)
The Role of 5G in Driving Mobile Data Usage
5G is a game-changer, not just for speed but for enabling new applications.
In 2025, 5G will power 80% of mobile traffic with far-reaching effects.
Some of the note-worthy effects are:
- Data Appetite: 5G users consume 2-3x more data than 4G users, averaging 50-70 GB/month in markets like South Korea and the UAE as shown in the tables. 8K video (20 GB/hour) and cloud gaming are key drivers, 5G’s 1 Gbps speeds making them seamless.
- Plan Evolution: 5G markets offer 50 GB+ plans as standard. In the USA, for example, Verizon’s unlimited 5G plans start at 100 GB, with 30% of users opting for premium tiers.
- New Use Cases: 5G enables smart cities. For instance, China’s Shenzhen had about 1 million sensors/km², this includes both IoT, and AR/VR devices. Saudi Arabia’s NEOM uses 5G for real-time urban analytics, consuming 5 GB/hour per node.
- Low Latency: Apps like autonomous driving and remote surgery (these require <10ms latency), rely on 5G. In Germany, 5G-connected factories report 15% efficiency gains. Telemedicine depends on 5G.
How China’s 5G Boom Reveals the Future of Telco Billing
With over 1.25 billion mobile users, and 92% of them on 5G, China now generates more than 40 exabytes of mobile data every month.
This explosive growth has forced telecom providers to rethink both network infrastructure and billing systems.
One standout example is China Mobile, which uses dynamic pricing models to manage traffic effectively.
For instance, IoT data is billed at just $0.01/GB, while video streaming costs $0.05/GB.
This segmentation not only optimizes network load but also boosts revenue.
Legacy billing systems struggle under the weight of such real-time demands, especially when tracking millions of micro-transactions across different use cases.
This is where Tridens’ AWS-based billing platform excels.
It can replicate dynamic pricing strategies, segment traffic by application, and scale to handle high-frequency 5G event processing—all in real time.
Without such advanced systems, telcos risk revenue leakage from unbilled or delayed data usage. Tridens enables telecom providers in all tiers to maintain the pace with 5G growth and monetize every byte effectively.
Telecom Billing and Monetization
The mobile data boom demands a billing overhaul.
Static plans like “10 GB for $30” can’t handle 5G’s dynamic usage and diverse needs. Modern monetization solutions should have the following:
- Real-Time Billing: Monetization solutions should be able to process millions of events (e.g., video streams, IoT pings) instantly, vital for 5G and OTT services. A UK telecom could bill TikTok streams at £0.01/GB live, capturing every byte.
- AI-Powered Insights: The monetization solution should be AI powered to be able to predict trends (e.g., gaming spikes during holidays) to suggest tariffs. A UAE provider might upsell 100 GB plans to AR/VR users, lifting revenue 10%.
- Scalable Micro-Transactions: The solution should support complex pricing—like per-second IoT billing or tiered 5G speeds. China’s 1 billion(plus) IoT devices require this kind of precision.
- Integration: Monetization and billing solutions should sync with CRMs like Salesforce and payment gateways (Stripe, PayPal). For example, Telemach’s 5-month migration to Tridens’ platform cut integration time by 50%.
Business Impact of Effective Billing and Monetization
- Higher ARPU: Dynamic plans boost revenue by 15-20%, per GSMA. A $5 streaming add-on could add $50M yearly for a 10M-user telecom.
- Personalization: Tailored plans—like gaming bundles for South Korea—improve retention by 25%.
- Premium Monetization: Charging $5/month for low latency 5G (e.g., VR gaming) taps new streams.
Mobile Data by 2030
Mobile data statistics show that by 2030, mobile data will be inseparable from daily life. It is already happening.
The table below gives some projections highlights:
| Year | Avg. hours/day | Data consumption (EB/month) |
|---|---|---|
| 2025 | 4.5h | ~218.5 EB/month |
| 2030 | 6h | 500+ EB/month |
Drivers of Growth in Mobile Data Consumption
AI Integration: By 2025, 25% of smartphones already run on-device AI (e.g., Gemini), using 2-5 GB/day for tasks like translation. By 2030, 50% will be AI-native, adding 100 EB/month.
VR/AR Explosion: More than 80 million VR users by 2030 spend 1 hour/day, consuming 10-20 GB/hour for metaverse apps. NEOM’s VR trials could lead this shift.
IoT Surge: 30 billion IoT devices (sensors, vehicles) generate 50 EB/month (requires micro-billing solutions).
The Dawn of 6G: 6G trials by 2030 will probably offer 100x 5G speeds, enabling futuristic holographic calls (50 GB/hour).
Challenges in Mobile Data
Energy Costs: Video traffic alone uses 14.4 billion kWh/month, 5x London’s electricity. Efficient billing can offset infrastructure costs.
Digital Divide: 2.6 billion people, mostly in Africa and South Asia, remain offline.
Mobile data statistics for 2025 reveals a transformed world. Again, with more than 7 billion users generating 200+ exabytes monthly.
Mobile usage has evolved from calls to data-driven lives—streaming, gaming, banking, and much more.
Telecoms are facing some vital decisions. Firstly, they should adapt billing to capture 5G, IoT, and future tech like AI and VR, or risk obsolescence.
Tridens Monetization leads the charge, delivering cloud-native platforms that scale, personalize, and maximize ARPU.
As the 2030’s 500+ exabytes loom, our solutions ensure telecoms don’t just survive – but dominate the market.