If we want to produce a high-quality of our Oracle BRM software, we must meet some requirements regarding our development process. It is especially important to incorporate good testing and debugging techniques in our development process.
Testing is a process of finding bugs or errors in a software product that is done manually by a tester or can be automated.
Debugging is the process of finding and resolving defects or problems within a computer program that prevent correct operation of computer software or a system. It is basically a process of fixing the bugs found in testing phase. Programmer or developer is responsible for debugging and it can’t be automated.
Table of contents
Debugging Oracle BRM policy opcodes custom code
When customizing policy opcodes in Oracle BRM it is often needed to debug some code to find potential bugs or analyze code behavior. Some basic analysis can be done with logging some debug messages and analyzing logs, but much more advanced and powerful method is to use a separate tool – debugger. In this article we will look at how we can use open-source debugger GDB to debug an Oracle BRM cm process which performs also some custom code (see the picture underneath).
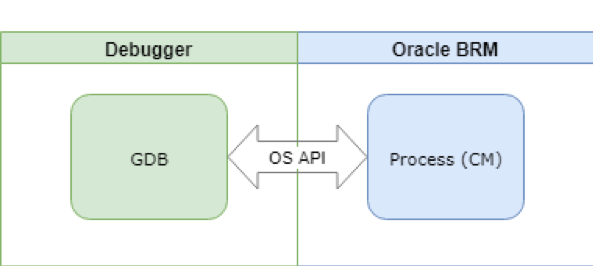
GDB is an open-source debugger that provides many advanced and powerful tools to analyze and debug our code. Some of GDB’s basic features are breakpoints (conditional/unconditional), watches, back traces and incremental code execution. You can of course also view and modify variable values and call various functions. Now let’s look at how we use GDB with cm process in practice.
Debugging in practice
First, we must get a PID of our CM process:
ps x
Find CM process PID and use it to connect to that process with GDB:
gdb cm
Now GDB shell opens where we can execute various commands that GDB supports. Each new connection that is established to CM causes spawning of new child CM process from parent CM. We want GDB to also track such child processes. Execute following command in GDB shell:
(gdb) set follow-fork-mode child
Depending on your needs you may also want to explore commands set detach-on-fork and attach. Now let’s set some breakpoint to some policy opcode implementation, like following example:
(gdb) break fm_act_pol_post_reauthorize.c:192
When we now trigger policy opcode execution, it will be interrupted by breakpoint (or even before that it will notify us that new child was spawned). We can then follow code flow step-by-step using commands next (abbr. n) or step. If we are interested in some variable value, we can print it out using:
print <variable>

Many more advanced and powerful features are also at our disposal which are described in GDB documentation and integrated help in detail. You are invited to research them to see how they can help you.