Czym są rozliczenia IoT?
Zanim odpowiemy na to pytanie, musimy zrozumieć Internet Rzeczy (IoT). W jednym z naszych wcześniejszych artykułów wyjaśniliśmy wszystko na temat Internet rzeczy. Tym razem omówimy rozliczenia IoT, wyzwania i klucze do ich rozwiązania.
Połączenie między inteligentnymi urządzeniami i wszystkim innym nazywane jest Internetem Rzeczy (IoT). Od momentu, gdy budzimy się i chwytamy za telefon, do chwili, gdy kładziemy się w łóżku i prosimy Alexę o wyłączenie światła, jesteśmy połączeni.
Przewiduje się, że nastąpi ogromny wzrost liczby urządzeń Internetu rzeczy (IoT), zwłaszcza wraz ze wzrostem popularności Internetu rzeczy. Monetyzacja 5G i nowe przypadki użycia, które umożliwia.
Urządzenia te gromadzą dane w celu poprawy jakości naszego życia poprzez tworzenie wydajnych i niemal doskonałych doświadczeń.
Niektórzy sugerują, że do 2025 roku branża urządzeń IoT będzie warta do $11 bilionów na całym świecie. Zgodnie z oczekiwaniami, technologia wyprzedza każdy inny biznes. Firmy, które nie są w stanie nadążyć za wyzwaniami związanymi z postępem technologicznym, ryzykują porażkę.
Jednym z wielu wyzwań wprowadzonych przez te innowacje jest skuteczne rozliczanie IoT dla monetyzacja. Obecnie firmy są zmuszone do dostosowania swoich systemy rozliczeniowe odpowiednio.
Spis treści
Nowy rodzaj rozliczeń w erze 5G IoT
Opłaty cykliczne, Skonsolidowane rozliczenia i fakturowanie, rozliczenia cykliczneróżne metody płatności, kolekcje, oszukanie, rozliczanie przychodówoświadczenia o produkcie, rozliczenia i zarządzanie przychodamiitp. składają się na system rozliczeniowy.
Te aspekty działalności były tradycyjnie szczególnym obszarem dla ekspertów. Aby jednak czerpać korzyści z IoT, konwencjonalne systemy rozliczeniowe muszą być zintegrowane ze wszystkimi aspektami działalności firm.
Odpowiedź brzmi oprogramowanie do fakturowania dla przedsiębiorstw z miejscem na progresywne i wymagające struktury cenowe i modele biznesowe.
IoT może stwarzać pewne trudności w rozliczeniach, ale możliwości, jakie stwarza, są znacznie większe niż problemy. Przez długi czas transakcje były proste i bezpośrednie. Kupujący kupowali produkty, dokonywano płatności z góry i sprzedaż się kończyła.
Transakcja była zamknięta, dopóki kupujący nie potrzebował ponownie tego produktu. Jednak metoda tych transakcji biznesowych przechodzi do historii, szczególnie w sprzedaży B2B.
Poniżej znajdują się cztery istotne wyzwania związane z rozliczeniami IoT w erze 5G i ich możliwe rozwiązania. Rozwiązania te mogą prowadzić do zrównoważonego rozwoju każdej firmy, która je stosuje.
Struktura finansowa IoT i rozdrobnionych przedsiębiorstw
Urządzenia gromadzą niewyobrażalną ilość danych. Jeśli dane te zostaną prawidłowo skonsolidowane i przeanalizowane, mogą zapewnić nieskończoną i zyskowną inteligencję.
Niestety, firmy tkwiące w archaicznych systemach rozliczeniowych nie mogą w pełni wykorzystać możliwości, które mogą wynikać z danych gromadzonych przez IoT.
Informacje w tych firmach muszą być ręcznie konsolidowane. Prowadzi to do wielu problemów, takich jak strata czasu i zasobów, błędy i utrata istotnych szczegółów dotyczących relacji z klientami.
Staromodna metoda gromadzenia, aktualizowania i analizowania danych szybko staje się barierą dla rozwoju firmy.
Click and Grow to przykład firmy wykorzystującej swoje dane do tworzenia postępów we wszystkich aspektach swojej działalności. Click and Grow to firma specjalizująca się w dostarczaniu inteligentnych urządzeń ogrodniczych. Prowadzi usługę subskrypcji strąków roślin połączonych i sparowanych z jej inteligentnymi urządzeniami. Urządzenia te są powszechnie sprzedawane zarówno sprzedawcom, jak i klientom.
Urządzenia te stale gromadzą informacje, aby umożliwić klientom bezproblemowe korzystanie z domowego ogrodu. Dane zbierane przez urządzenia są wykorzystywane do kontrolowania poziomu składników odżywczych, światła i wody w ogrodzie.
Te potrzeby roślin są śledzone za pomocą aplikacji połączonej z komputerem lub telefonem użytkownika. W przypadku Click and Grow istnieje stała komunikacja między użytkownikami:
- Urządzenie IoT i różne wykonywane przez nie zadania.
- Urządzenie i jego producenci.
- Firma, jej dostawcy i użytkownicy końcowi.
- Urządzenie i użytkownicy końcowi.
Jeśli żaden system nie będzie skutecznie gromadził informacji i zarządzał nimi, firma będzie miała trudności z konkurencyjnością i rozwojem. Zastąpienie technologii zarządzania, wielu rozliczeń IoT i informacji zintegrowanym systemem może zapewnić scentralizowaną komunikację i zarządzanie.
Przejrzystość dostarczanych danych skutkuje elastycznością w dokonywaniu dostosowań i podejmowaniu decyzji biznesowych w oparciu o stałe wymagania i wzorce rynkowe. Wskazuje również nowe możliwości biznesowe w zakresie tworzenia nowych produktów na nowy rynek.
Dane zebrane przez to urządzenie dostarczają szczegółowych informacji o tym, jak najlepiej zapakować produkt i sprzedać go klientom. Daje również wgląd w ulepszanie produktu i wprowadzanie niezbędnych zmian, aby jak najlepiej służyć użytkownikom.
Aplikacja Click and Grow rejestruje styl życia roślin każdego klienta. W ten sposób może prawidłowo kierować nowe oferty i reklamy.
Reklamy zachęcają klientów, którzy nie wykupili subskrypcji, do wymiany roślin w razie potrzeby. Może również udostępnić produkt subskrybującym klientom we właściwym czasie.
Zarejestrowane dane można również wykorzystać do określenia, kiedy istnieje zapotrzebowanie na nowy produkt. Pokazuje również, kiedy istnieje potrzeba ulepszenia lub zwiększenia produkcji i dystrybucji produktu.
Skomplikowany łańcuch wartości w systemie IoT
Dzięki IoT proces biznesowy nie jest już prostą relacją między sprzedawcą, kupującym i produktem. Sięga on tak daleko, jak połączenie sprzedawców, producentów, odsprzedawców i użytkowników końcowych.
Te połączenia z kanałami biznesowymi tworzą złożony łańcuch. Obsługa klienta, generowanie przychodów i fakturowanie, które odbywają się regularnie, są gromadzone w jednym systemie w ustrukturyzowany sposób.
Ta forma umożliwia przekazywanie informacji z powrotem do producentów, operatorów i dostawców usług. Ponadto informacje zebrane dzięki tej interakcji mogą przekazywać informacje o klientach sprzedawcom.
Na przykład Sonos i kilku innych dostawców produkuje i sprzedaje inteligentne głośniki, tworząc sieć transakcji.
Następnie użytkownicy łączą się z urządzeniem za pośrednictwem dedykowanej aplikacji Sonos i streamują treści od różnych partnerów streamingowych. Wszyscy z nich indywidualnie gromadzą i przechowują dane w oparciu o rodzaj treści przesyłanych strumieniowo przez użytkowników i oferują regularne rozliczenia. Tutaj opcje strumieniowania i zaktualizowane funkcje synchronizują Sonos i urządzenie.
System zarządzania przychodami musi skutecznie zarządzać przepływem utworzonym przez ten złożony łańcuch. Należy to zrobić w taki sposób, aby rozliczenia były obsługiwane na wszystkich poziomach transakcji.
Jak wyjaśniono powyżej, przestarzałe systemy rozliczeniowe nie są w stanie stworzyć takiego przepływu systemowego. W rezultacie dochodzi do przerwy w danych dotyczących relacji z klientami.
Aby rozwiązać ten problem, starsze systemy mogą nabywać hurtownie danych do przechowywania informacji o klientach. Hurtownia ta powoli staje się wysypiskiem śmieci. Dzieje się tak, ponieważ ręczne uzyskiwanie dostępu do wszystkich tych danych i wprowadzanie ich do Excela jest wyczerpujące i czasochłonne.
Klienci oczekują od firmy najlepszych i aktualnych usług. Dlatego przestarzały system rozliczeniowy będzie przede wszystkim niezadowalający i stresujący dla większości klientów. Niezwykle ważne jest, aby systemy rozliczeniowe spełniały oczekiwania klientów, jeśli firma zamierza ich zatrzymać.
Istnieje również problem tworzenia kilku systemów dla sprzedawców, którzy obsługują kilka punktów sprzedaży, ponieważ może to powoli stać się łańcuchem chaotycznych informacji.
Rozwiązaniem pozwalającym uniknąć korzystania z kilku systemów od wielu dostawców jest skorzystanie z usług tylko jednego dostawcy. Powinien to być dostawca, który jest w stanie zapewnić kompleksowe rozwiązania IoT dla wymagań ekosystemu w zakresie rozliczeń i zarządzania finansami.
Przestarzałe rozwiązania rozliczeniowe a wymagania cenowe IoT
Produkty oparte na subskrypcji przynoszą korzyści sprzedawcom dzięki przewidywalności zakupów i nagradzają lojalność klientów. Modele monetyzacji i struktury cenowe ustanowione przez IoT szybko wypierają struktury rozliczeniowe firm, które nie są oparte na IoT.
Klienci mają opcje i będą domagać się bardziej odpowiedniego doświadczenia zakupowego. Dotyczy to również sposobu rozliczania i wysyłania faktur. Klienci stale doceniają i chcą komfortu hybrydowych opcji cenowych.
Firmy muszą być elastyczne i czujne, aby prosperować na nasyconym rynku IoT. Konieczne jest aktywne śledzenie trendów w zakresie kreatywnych rabatów dla konkurentów, ofert pakietowych i nowych cen.
Ponadto, starsze systemy bilingowe zwykle zajmują się tylko częścią kwestii rozliczeń IoT, takich jak zarządzanie projektami, subskrypcje, zarządzanie wydatkami i jednorazowe zakupy. Takie jednostronne podejście jest nieskuteczne. Ponadto klienci zazwyczaj kupują wyżej wymienione usługi od wielu dostawców w ramach jednego zamówienia.
Innym zauważalnym rosnącym trendem jest rozliczanie na podstawie zużycia. Firmy, które go stosują, zwiększają swoje przychody w ekosystemie IoT.
Ta metoda rozliczeń była wcześniej stosowana tylko przez firmy telekomunikacyjne i użyteczności publicznej. Ponieważ klienci woleliby płacić za to, czego faktycznie używają, szybko rozprzestrzenia się na inne branże.
Ten model rozliczeń pozwala konsumentom na korzystanie z produktów, wiedząc, że są one rozliczane zgodnie z ich zużyciem. Eliminuje to możliwość niepotrzebnych opłat.
Firmy wykorzystują również dane zebrane z rozliczeń opartych na zużyciu, aby odpowiednio przydzielić swoje zasoby do swoich klientów.
Model rozliczeń oparty na zużyciu stwarza również sytuacje, w których klienci, których nie stać na produkt lub usługę, płacą w miarę ich używania. Rozliczenia cykliczne umożliwiają spłatę kosztów zakupu w czasie.
Firmy, które przyjmują starsze systemy rozliczeniowe, są głównie nieelastyczne i nie są w stanie nadążyć za stale zmieniającymi się wymaganiami dotyczącymi użytkowania. Elastyczne systemy są często bardziej dostosowane do nowoczesnych metod monetyzacji.
Zwiększona złożoność rozliczeń IoT
Świadome lub przypadkowe złożenie błędnej deklaracji przychodów może skutkować sankcjami prawnymi i koniecznością skorygowania dochodu. Dyrektorzy firm obawiają się podejmowania takiego ryzyka. Dlatego ważne jest, aby firmy ostrożnie podchodziły do rozpoznawania przychodów.
Według ASC 606Firmy subskrypcyjne nie mogą rejestrować swoich przychodów do momentu dostarczenia wartości. Standardy dotyczące rozpoznawanie przychodów komplikują rozliczenia IoT w zakresie rozliczania przychodów z usług związanych z subskrypcją.
Ujmowanie przychodów kategoryzuje płatności jako uzyskane/uznane lub odroczone.
System rozliczeniowy używany przez firmę powinien uwzględniać odroczone przychody. Powinien upewnić się, że dochód nie jest rejestrowany przedwcześnie. Wynika to z faktu, że rozliczenia i przychody są rozpoznawane i rejestrowane stopniowo każdego dnia.
I odwrotnie, nie powinien być akceptowany przed końcem okresu rozliczeniowego, aby uniknąć błędów w zapisach.
Stare systemy rozliczeniowe Point nie są w stanie sprostać dynamicznym wymaganiom ASC. Nie mają wymaganych danych do dokładnego rozpoznania przychodu z zakończonej transakcji. A ponieważ systemy zmieniają się w czasie, nie mogą nadążyć i rejestrować dokładnych danych.
Ze względu na tę lukę w systemie, firmy prowadzące punktowe systemy rozliczeniowe mają dwie alternatywy. Mogą ręcznie kontrolować swoje zamówienia i subskrypcje.
Metoda ta jest również ryzykowna i podatna na błędy. Alternatywą jest zakup innego systemu rozpoznawania przychodów - ta opcja jest droga i trudna do zintegrowania. Metody ręczne są również ryzykowne i podatne na błędy.
Systemy rozliczeniowe muszą być w stanie aktualizować zmiany wprowadzone w fazie subskrypcji IoT klienta. Zapisy te mogą obejmować:
- Anulowanie
- Rabaty
- Bezpłatne okresy próbne
- Aktualizacje
- Obniżki ratingów
Pozostawienie tych zmian do ręcznego wprowadzenia może skutkować błędami w rozpoznawaniu przychodów.
Nowoczesny i skuteczny system rozliczeniowy zautomatyzuje proces rozpoznawania przychodów z dużą dokładnością. Dzięki temu firma może skupić się na rozwoju.
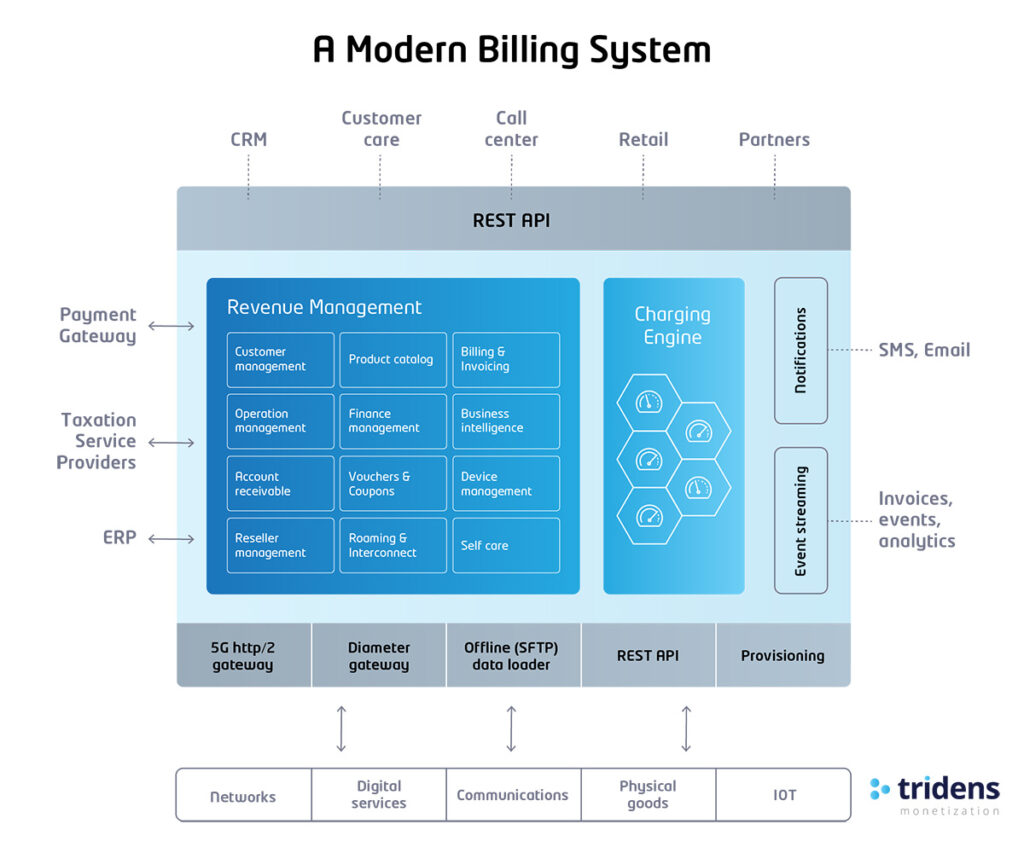
Na przykład, Tridens Monetization, nowoczesny system rozliczeń cyklicznychzostał zaprojektowany w oparciu o potężną platformę opartą na księdze rachunkowej. Umożliwia również kontrolę rozpoznawania przychodów na etapie produktu. Pozwala również na zarabianie natychmiastowych jednorazowych opłat lub przez określony czas.
Usprawnienie rozliczeń IoT jest niezbędną strategią biznesową
Wszystkie kwestie związane z rozliczeniami IoT mają wzajemny podział między firmami a istotnymi danymi. Są to dane, które firmy mogą wykorzystać.
Informacje te mogą być wykorzystywane do zarządzania strukturą cenową firmy w porównaniu z zapotrzebowaniem cenowym na rynku. Ponadto mogą zarządzać kompleksowymi łańcuchami rozliczeniowymi i nowoczesnymi standardami rachunkowości.
Odpowiednie partnerstwa i technologie umożliwią firmom:
- Rozwijać, poznawać i zwiększać swoją przewagę konkurencyjną niezależnie od zmian rynkowych.
- Wykorzystanie wszystkich zebranych informacji do zarządzania podróżą klienta i wykorzystania IoT.
- Prawidłowe i szybkie gromadzenie i analizowanie danych
- W razie potrzeby edytować procesy rozliczeniowe
Podstawowym rozwiązaniem problemów z rozliczeniami jest wdrożenie nowoczesnych systemów rozliczeniowych. Systemy te muszą być zgodne z holistycznymi potrzebami biznesowymi. Muszą również umożliwiać płynną wymianę danych pomiędzy różnymi mechanizmami technologicznymi i biznesowymi.
Chcesz uzyskać więcej informacji o naszych rozwiązaniach? Zostaw komentarz poniżej lub Zaplanuj prezentację!