BI analytics for revenue and business operations
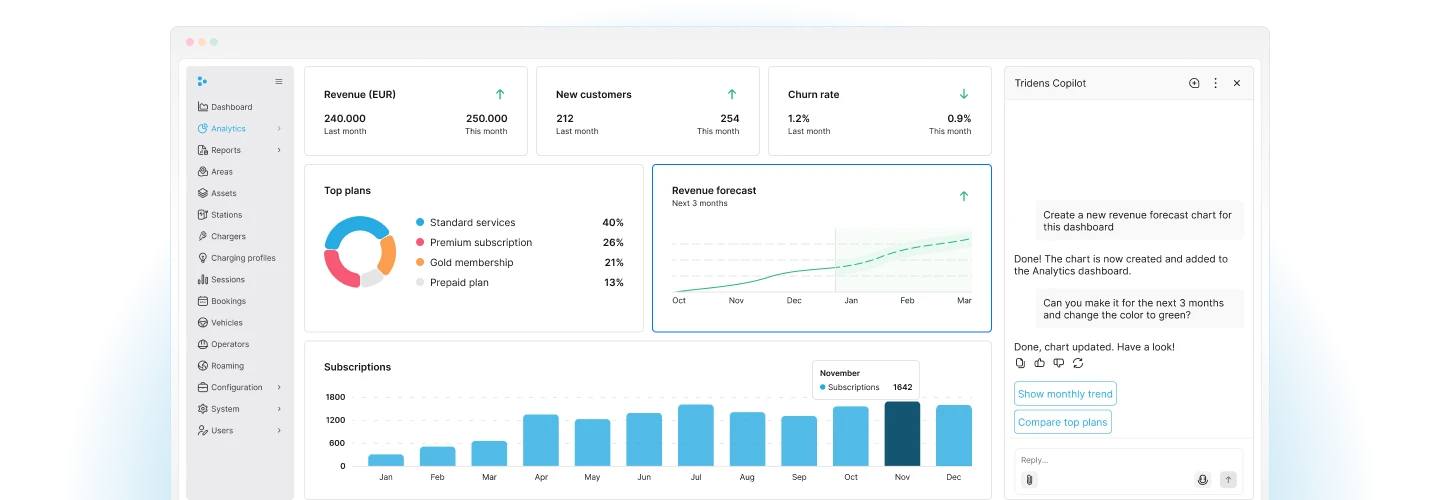
Turn your business data into dashboards, custom reports, and forecasts. Track revenue and operations, explore trends, and give each team a clearer view of performance.
basierend auf über 120 Bewertungen
Trusted by teams across the Tridens platform.
Wie es funktioniert
From connecting your sources to building the right reports, we shape your analytics around the questions your teams need to answer.
01
Connect your data
Identify the data behind your business questions. We connect supported sources so your dashboards and reports use the information you need.
02
Define your KPIs
Choose the metrics that matter to your teams. We build dashboards and reports around your priorities, processes, and reporting requirements.
03
Understand and plan
Review performance, explore trends, and use forecasts to guide your planning. Give teams a clearer view of what to focus on next.
Reports built for you
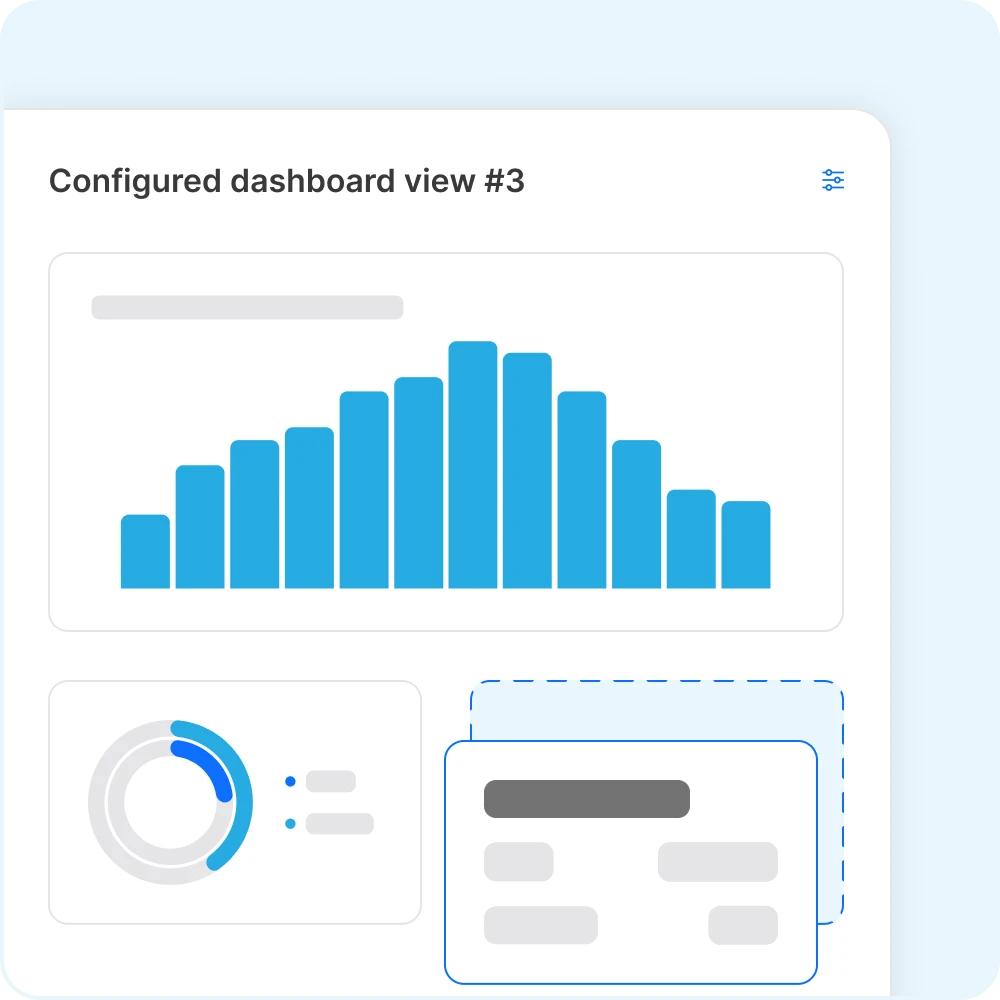
Create dashboards and custom reports around the questions your business needs to answer.
Track revenue, usage, and operational performance, with views tailored to finance, operations, and management. Give each team the metrics it needs to understand results and decide what to do next.
Bring your data together
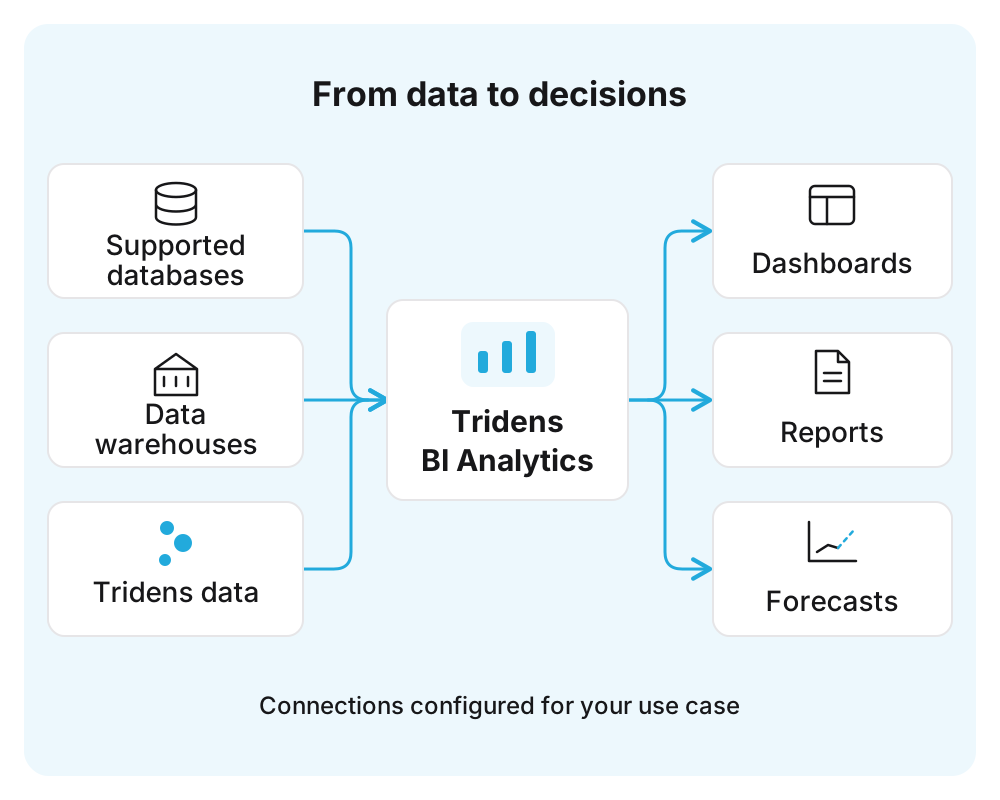
Connect data from Tridens products, supported databases, and data warehouses to build a more complete view of your business.
We configure the connections around your reporting needs, helping you bring relevant information together for analysis and planning.
Entdecken Sie die Entwicklerplattform
Plan ahead with forecasts
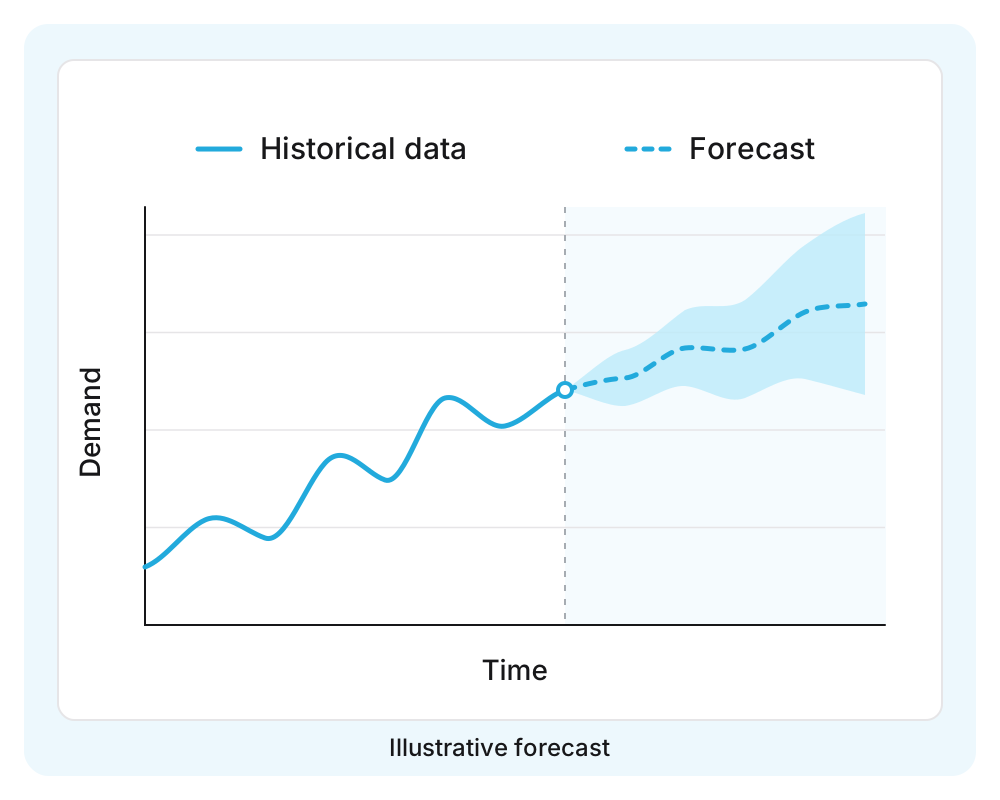
Use historical data to explore what could come next for revenue, usage, and operational demand.
We tailor forecasts to your business goals and available data, helping your teams understand trends and make better-informed plans.
Sind Sie bereit anzufangen?
Learn how your business can thrive with Tridens' BI analytics.
Planen Sie eine DemoA more conversational way to work with data
Discuss opportunities for natural-language questions, assisted data exploration, and chart creation within your analytics workflows.
Ask in your own words
Explore natural-language questions about your business data to make analytics more accessible to the people who use it.
EXAMPLE QUESTION
“How is revenue trending this month?”
Einnahmen
Usage
Performance
Explore Tridens AI capabilites
Explore with assistance
Discuss AI support for navigating datasets, investigating trends, and building queries that help your teams find relevant information.
Datasets
Trends
Queries
Turn questions into views
Consider assisted chart creation to turn business questions into clear visual answers for your reporting workflows.
Charts
Reports
Insights
FAQs
Falls Sie noch Zweifel haben.
What is Tridens BI Analytics?
Tridens BI Analytics combines custom dashboards, reporting, and forecasting around your business data. It helps teams track performance, understand trends, and plan their next steps.
Can you create custom reports?
Yes. We build dashboards and reports around your business questions, KPIs, and teams.
Which data sources can we connect?
Connect Tridens products and supported databases and warehouses. We confirm the connections needed for your implementation.
What can we forecast?
Use suitable historical data to forecast revenue, usage, and operational demand.
Is it based on Apache Superset?
Yes. Apache Superset provides the analytics foundation, extended by Tridens with tailored connections, reports, and forecasting.
How do we get started?
Book a demo to discuss your data sources, reporting needs, and goals.