This blog provides comprehensive insights into the telecommunication industry statistics, including trends and future outlooks. Read on!
Table of contents
- Milestone Telecom Industry
- Challenges in the Telecommunications Industry
- The Rise of 5G
- Mobile Traffic Growth Worldwide
- Annual Mobile Data Traffic Worldwide
- Communication Services Revenue
- Telco Market Share
- Leading Smartphone Vendors
- Telecom Industry in the United States
- Canada Telecom Market Share
- European Telecommunications Industry
- Telecommunications Industry in UK
- China Telecommunications Industry Overview
- Telecommunications Industry in Africa, South Africa, and The Middle East
- Growth of Telecommunications Industry in India
- Australian Mobile Telecommunications Industry
- How is the Telecommunications Industry changing in 2026?
Key Notes
- 5G Adoption: It is expected that 5G adoption will increase to 66% by 2030, resulting in roughly 6.4 billion connections. As of the end of 2025, global 5G connections have surpassed 2.9 billion, on track to overtake 4G by 2027.
- Economic Impact: 5G will add almost 1 trillion USD to the global economy by 2030, with benefits extending across various industries.
- Mobile Subscriptions: By the end of 2025, there were over 5.9 billion people globally subscribed to a mobile service. 4.7 billion people (around 58% of the world’s population) were also using mobile internet – a figure expected to rise to 5.5 billion (64% of population) by 2030.
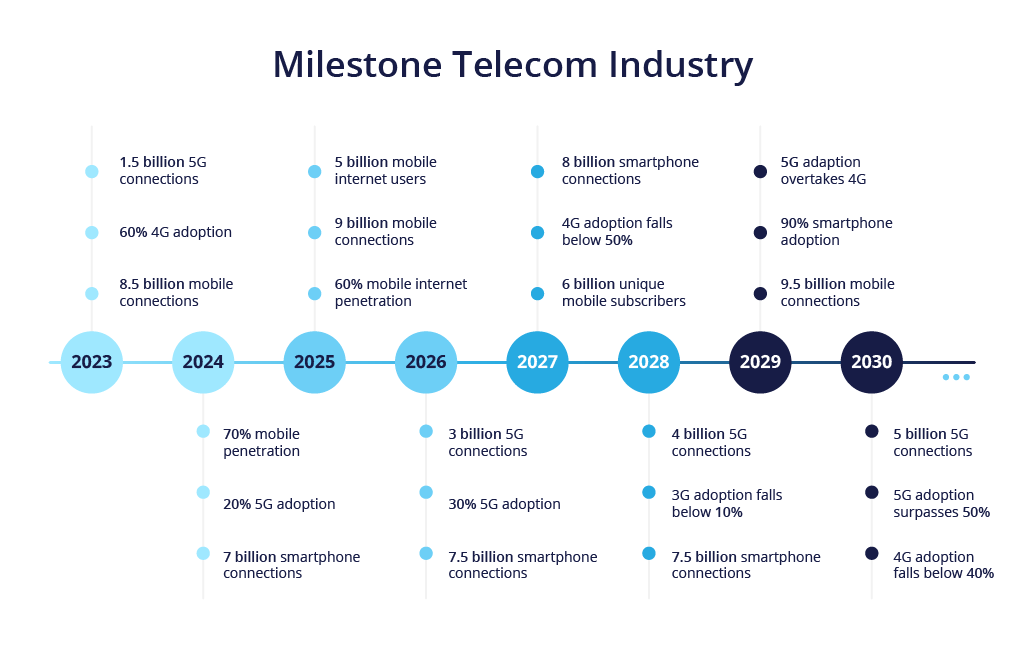
Milestone Telecom Industry
Challenges in the Telecommunications Industry
The telecommunication industry’s exponential growth has introduced new challenges.
Telecom companies need to keep pace with challenges like IoT, Generative AI, cloud computing, no-code configuration, open APIs, and many more.
They also face pressures in cybersecurity and regulatory compliance, as well as challenges with the rise of eSIM technology.
Related read: Cloud Computing in 2025
Key trends shaping the telecommunication industry:
- The focus on 5G monetization as new markets launch 5G services.
- The momentum in private 5G networks for enterprise applications.
- The industry’s shift towards sustainability and circularity.
- The growth of the metaverse driven by 5G and AI capabilities.
Related read: Telecom industry trends for 2025
The Rise of 5G
The rapid growth of 5G technology is clear, with over 360 commercial 5G networks operating globally as of 2025.
In fact, the rise of 5G is leading to a decline in the use of legacy networks like 2G and 3G.
Also, most new smartphones nowadays come equipped with 5G capabilities.
5G adoption is accelerating faster than 4G did and is on track to become the dominant mobile technology by 2027.
This trend is evident in leading markets such as:
- United States,
- South Korea,
- China,
- Japan,
- Germany.
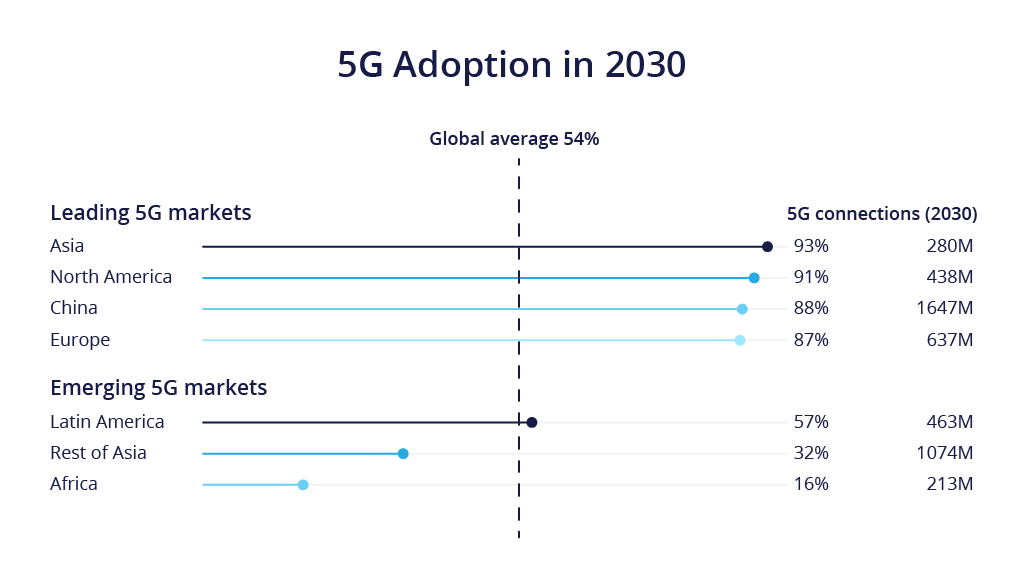
The picture below displays the projected level of 5G adoption in different markets by the year 2030:
Mobile Traffic Growth Worldwide
Global mobile data traffic continues to grow at an impressive pace.
In 2021, the pandemic greatly affected mobile data traffic as more people started working and studying from home.
The growth in mobile data can be attributed to several factors:
- Increasing number of mobile devices and users.
- Growing popularity of data-heavy applications such as video streaming and online gaming.
- Deployment of 5G networks.
For example, video traffic alone is estimated to comprise about 71% of all mobile data traffic, and is projected to increase to 80% by 2028.
The surge of mobile video streaming on social media platforms (Youtube, TikTok, etc.) is driving per-user data consumption to new highs.
The picture below represents the mobile data traffic per smartphone in different locations in 2022 with predictions for 2028:

On average people used roughly 21 GB of data per month in 2025 – a figure that continues to climb each year.
China with over 1.1 billion smartphone users is leading the way.
India follows, with around 700 million smartphone users that use 31 GB on average (an increase from ~25GB in 2022).
The United States has 310 million smartphone users and they roughly use 17-18 GB per month on average.
Average mobile data usage per smartphone is set to rise from 21 GB in 2023 to 56 GB in 2029.
The average monthly mobile data usage per smartphone in North America is expected to reach 56 GB in 2029.
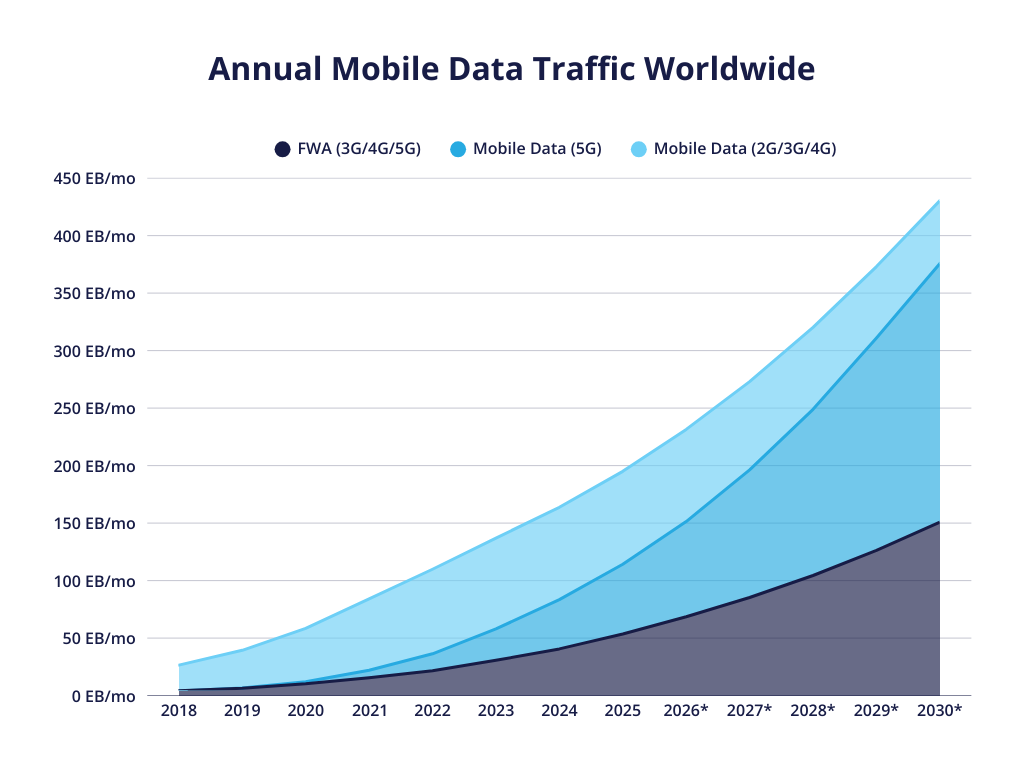
Annual Mobile Data Traffic Worldwide
In 2018 people used approximately 26.53 EB (exabytes) of mobile data per month.
1 EB is equal to 1,000,000,000 GB.
As mobile usage grows, the total volume of data flowing through wireless networks is exploding.
The graph represents an annual mobile data traffic (on a monthly basis) worldwide:
- FWA (3G/4G/5G),
- Mobile data (5G),
- Mobile data (2G/3G/4G).
| Year | FWA (3G/4G/5G) | Mobile Data (5G) | Mobile Data (2G/3G/4G) |
|---|---|---|---|
| 2018 | 4.11 EB/mo | / | 22.42 EB/mo |
| 2019 | 6.39 EB/mo | 0.12 EB/mo | 32.88 EB/mo |
| 2020 | 10.35 EB/mo | 1.73 EB/mo | 46.36 EB/mo |
| 2021 | 15.56 EB/mo | 6.55 EB/mo | 61.98 EB/mo |
| 2022 | 21.62 EB/mo | 14.72 EB/mo | 73.52 EB/mo |
| 2023 | 30.66 EB/mo | 27.32 EB/mo | 78.98 EB/mo |
| 2024 | 40.6 EB/mo | 42.82 EB/mo | 80.34 EB/mo |
| 2025 | 53.60 EB/mo | 60.61 EB/mo | 80.81 EB/mo |
| 2026* | 68.53 EB/mo | 82.81 EB/mo | 80.15 EB/mo |
| 2027* | 85.28 EB/mo | 111.01 EB/mo | 76.76 EB/mo |
| 2028* | 104.45 EB/mo | 144.49 EB/mo | 71.27 EB/mo |
| 2029* | 126.27 EB/mo | 184.78 EB/mo | 62.05 EB/mo |
| 3030* | 150.76 EB/mo | 225.03 EB/mo | 54.66 EB/mo |
Source: Statista
According to the estimates, the amount of data used on mobile devices is projected to increase significantly, reaching a staggering 466.16 EB per month by 2029.
To put this in perspective, that would be over 17x the monthly traffic in 2018.
The increase is driven by continued smartphone adoption, richer media content like 4K/8K video and AR/VR applications, and expanded 5G coverage.
Communication Services Revenue
The telecommunication market is divided into:
- Fixed Data: Wired internet services using technologies like DSL, cable, or fiber optics.
- Fixed Voice: Traditional landline telephone services for voice communication.
- Mobile Data: Internet connectivity for mobile devices via cellular networks.
- Mobile Voice: Voice call services for cell phone users using wireless networks.
The chart below highlights the communication services revenue in four major markets from 2017 to 2023 in billion USD:
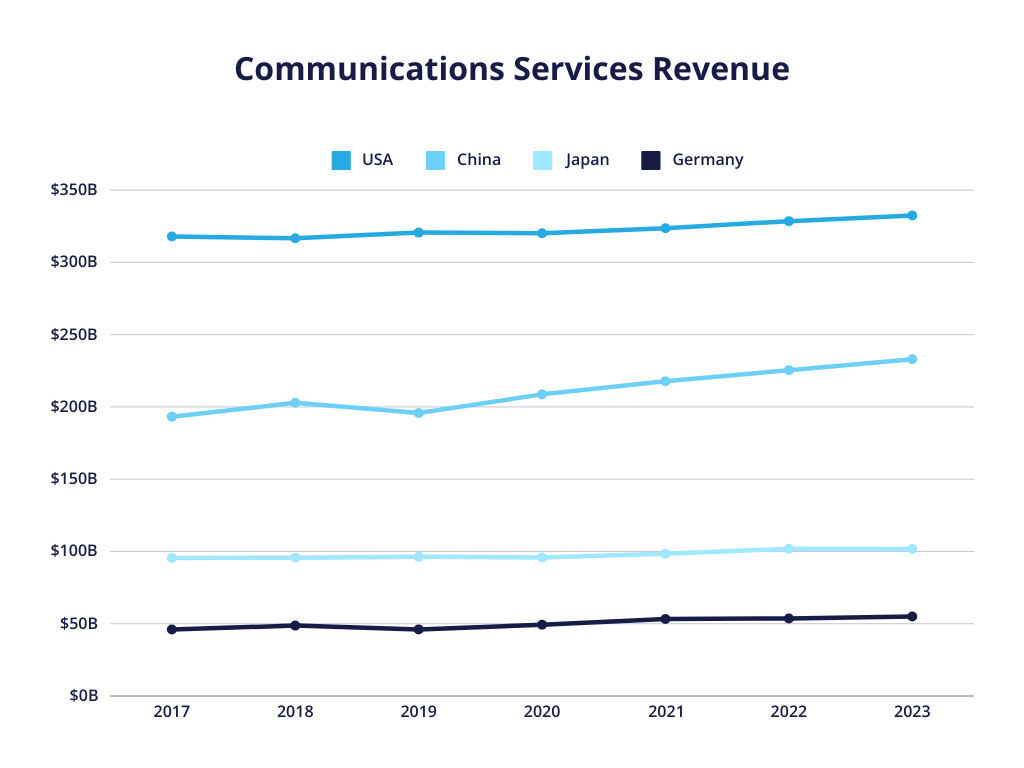
| Year | US | China | Japan | Germany |
|---|---|---|---|---|
| 2017 | $317.86 B | $193.28 B | $95.49 B | $46.05 B |
| 2018 | $316.64 B | $202.87 B | $95.73 B | $48.70 B |
| 2019 | $320.60 B | $195.78 B | $96.27 B | $46.08 B |
| 2020 | $320.13 B | $208.70 B | $95.88 B | $49.25 B |
| 2021 | $323.61 B | $217.73 B | $98.42 B | $53.33 B |
| 2022 | $328.52 B | $225.44 B | $101.84 B | $53.65 B |
| 2023 | $332.40 B | $232.95 B | $101.76 B | $54.94 B |
Source: Statista
As shown above, the US leads in telecom service revenue ($332.4 billion in 2023), followed by China ($232.95 billion).
Japan and Germany generated $100+ billion and $54.9 billion respectively in 2023.
Despite market saturation in many developed countries, revenues have grown each year.
Industry forecasts expect global telecom revenues to keep rising at a ~3% CAGR through 2028, reaching roughly $1.3 trillion worldwide.
Related read: Postpaid vs. Prepaid Plans: Which is the Best for You?
Telco Market Share
AT&T is the world’s biggest telecommunications company.
Biggest telecom companies in the world:
- AT&T,
- Verizon,
- China Mobile,
- SK Telecom,
- Deutsche Telekom,
- Vodafone,
- Telefonica.
In terms of subscribers, China Mobile is the world’s biggest telco by user base.
The company added 46.91 million subscribers in the 5G segment alone during 2025, ending that year with 599 million total 5G users.
For comparison, AT&T and Verizon are giants in revenue.
AT&T reported around $125.6 billion in annual telecom revenue (2025), while Verizon posted about $138.2 billion.
China Mobile generated a revenue of 98.40 billion EUR.
Leading Smartphone Vendors
Apple sells the most smartphones and has more than 1 billion iPhone users in the world.
Smartphone Vendors:
- Samsung 🇰🇷,
- Apple 🇺🇸,
- Xiaomi 🇨🇳,
- Huawei 🇨🇳,
- Oppo and Vivo 🇨🇳.
The market is primarily dominated by Apple and Samsung, but Xiaomi is also performing well.
For example, in 2025 Samsung held a 19% share of global smartphone shipments, while Apple led the market with a 20% share.
Here’s the graph that shows market share from Q1 2021 to Q1 2024:
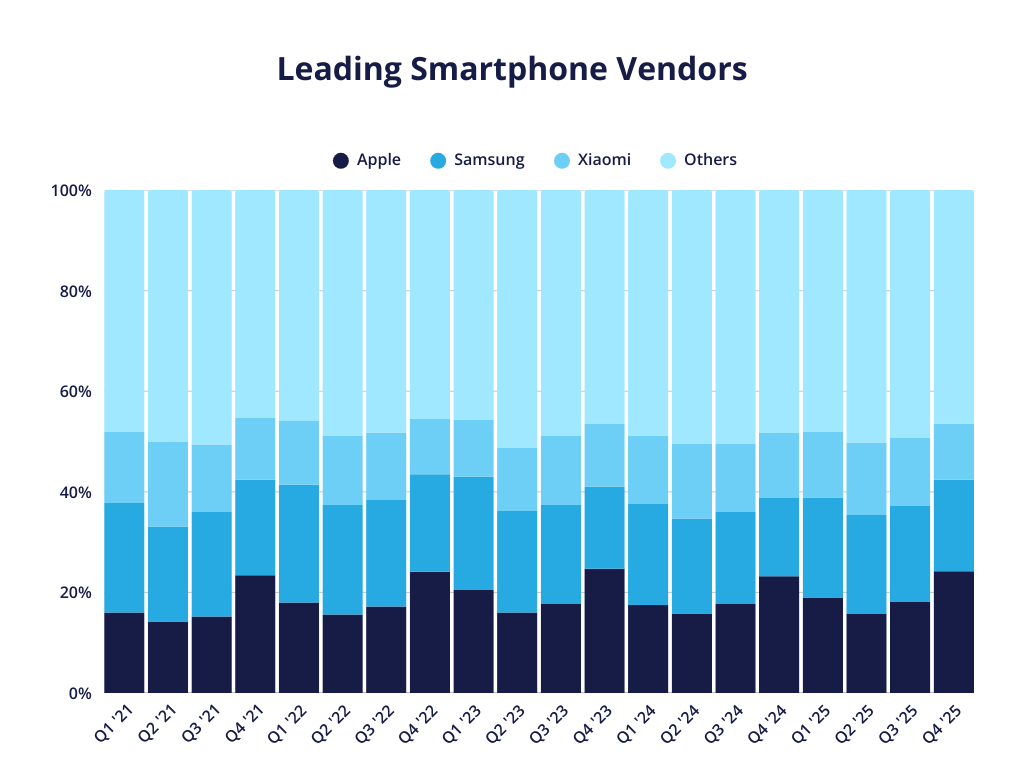
| Quarter | Apple | Samsung | Xiaomi | Others |
|---|---|---|---|---|
| Q1 2021 | 16% | 21.8% | 14.1% | 48.2% |
| Q2 2021 | 14.2% | 18.9% | 16.9% | 50% |
| Q3 2021 | 15.2% | 20.8% | 13.4% | 50.6% |
| Q4 2021 | 23.4% | 19% | 12.4% | 45.2% |
| Q1 2022 | 18% | 23.4% | 12.7% | 45.9% |
| Q2 2022 | 15.6% | 21.8% | 13.8% | 48.8% |
| Q3 2022 | 17.2% | 21.2% | 13.4% | 48.2% |
| Q4 2022 | 24.1% | 19.4% | 11% | 45.5% |
| Q1 2023 | 20.5% | 22.5% | 11.4% | 45.6% |
| Q2 2023 | 16% | 20.2% | 12.5% | 51.3% |
| Q3 2023 | 17.7% | 19.7% | 13.7% | 48.9% |
| Q4 2023 | 24.7% | 16.3% | 12.5% | 46.5% |
| Q1 2024 | 17.5% | 20.1% | 13.6% | 48.8% |
| Q2 2024 | 15.8% | 18.9% | 14.8% | 50.5% |
| Q3 2024 | 17.7% | 18.3% | 13.5% | 50.5% |
| Q4 2024 | 23.2% | 15.6% | 12.9% | 48.3% |
| Q1 2025 | 19% | 19.9% | 13% | 48.1% |
| Q2 2025 | 15.7% | 19.7% | 14.4% | 50.2% |
| Q3 2025 | 18.2% | 19% | 13.5% | 49.3% |
| Q4 2025 | 24.2% | 18.2% | 11.2% | 46.4% |
Source: Statista
Telecom Industry in the United States
The US telecom industry serves around 335 million people and is valued at a minimum of 118 billion USD, as estimated by the Federal Communications Commission (FCC).
There has been a significant increase in mobile subscriptions in recent years.
The number of mobile subscriptions reached 390.99 million in 2024, indicating a growth trend that shows no signs of slowing down.
The statistics of mobile subscriptions in the US telecom industry from 2010 to 2023:
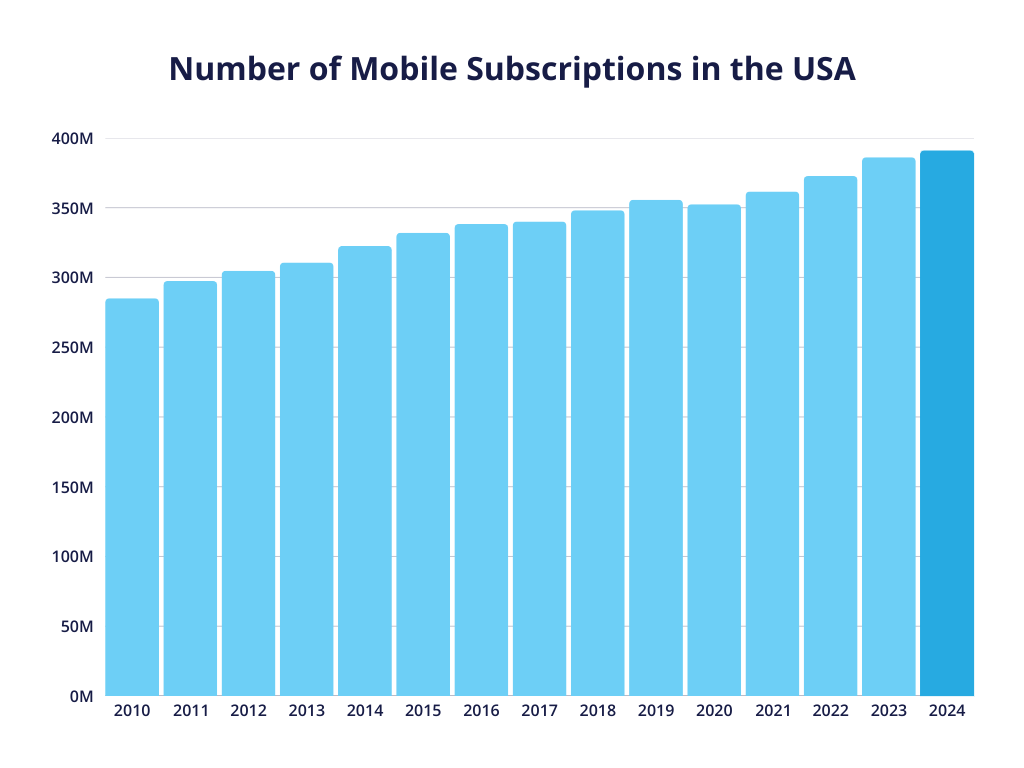
| Year | Number of mobile subscriptions in the USA |
|---|---|
| 2010 | 285.12 M |
| 2011 | 297.4 M |
| 2012 | 304.84 M |
| 2013 | 310.7 M |
| 2014 | 322.6 M |
| 2015 | 332.1 M |
| 2016 | 338.24 M |
| 2017 | 340.11 M |
| 2018 | 348.24 M |
| 2019 | 355.76 M |
| 2020 | 352.52 M |
| 2021 | 361.68 M |
| 2022 | 372.70 M |
| 2023 | 386.18 M |
| 2024 | 390.99 M |
Source: Statista
The United States now has almost 400 million smartphone users.
This means that the US now has a mobile penetration of around 115% since many people have more than one active subscription.
Major telecom companies in the USA:
- AT&T,
- T-Mobile,
- Verizon,
- Comcast,
- Charter Communications.
AT&T leads with 15.3 million connections and top customer satisfaction.
However, T-Mobile US offers the fastest 5G download speed and the best coverage in the US.
Verizon is the leader in revenue, with 134 billion USD reported for 2023.
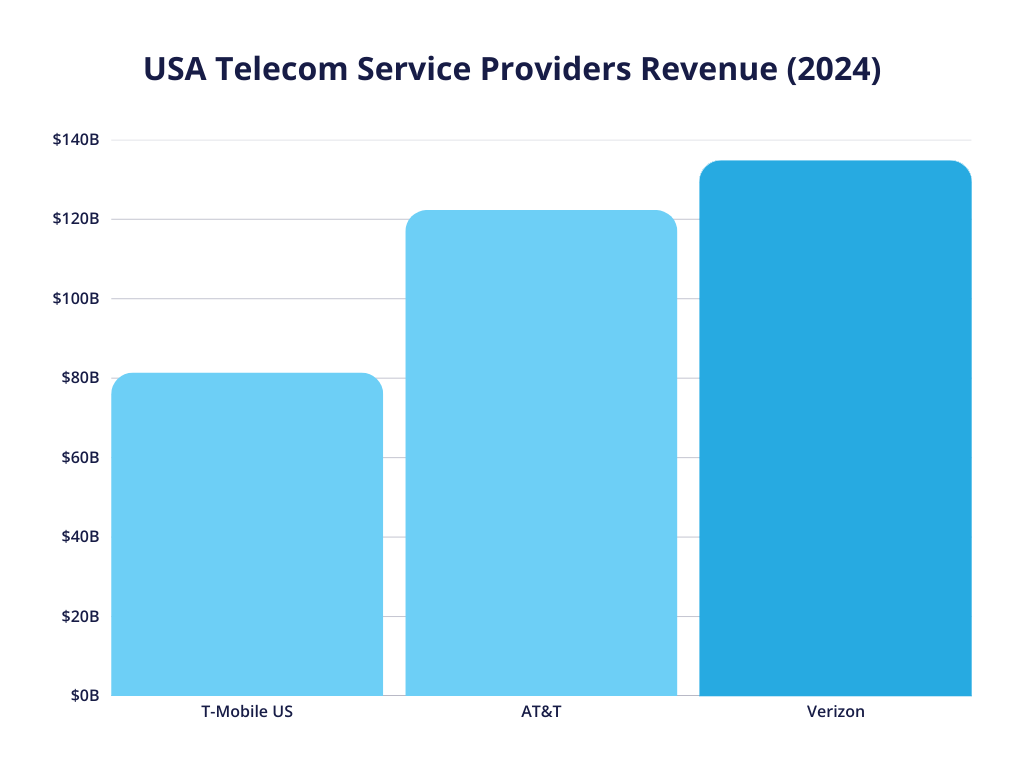
| Service Provider | Revenue in 2023 | Revenue in 2024 |
|---|---|---|
| Verizon | $133.97 B | $134.79 B |
| AT&T | $122.43 B | $122.34 B |
| T-Mobile US | $78.56 B | $81.4 B |
Source: Statista
Related read: Best MVNO Carriers in the USA (List)
Canada Telecom Market Share
The Canadian telecommunications market is dominated by “the big three”.

Biggest telecommunication companies in Canada:
- Rogers Wireless,
- Bell Mobility.
- Telus Mobility.
As of 2023, Rogers Wireless is the largest mobile operator in Canada, leading in subscriber share.

| Year | Bell | Telus | Rogers | Others |
|---|---|---|---|---|
| 2014 | 28.8% | 29.3% | 34.0% | 7.9% |
| 2015 | 29.0% | 29.3% | 33.6% | 8.1% |
| 2016 | 28.9% | 28.6% | 33.3% | 9.2% |
| 2017 | 30.7% | 27.8% | 33.3% | 8.2% |
| 2018 | 29.6% | 27.8% | 33.3% | 9.3% |
| 2019 | 29.5% | 27.7% | 32.9% | 9.9% |
| 2020 | 29.2% | 27.8% | 31.6% | 11.4% |
| 2021 | 29.2% | 28.1% | 31.1% | 11.6% |
| 2022 | 29.8% | 27.9% | 30.8% | 11.5% |
| 2023 | 29.8% | 27.8% | 31.9% | 10.5% |
Source: Statista
It held about 31.9% of mobile subscriptions in 2023, followed closely by Bell and Telus with roughly ~30% and ~28% each.
The market is split roughly one-third each among the big players.
There are a few smaller regional operators and some MVNOs, but they collectively make up under 10% of the market.
Canada is known for having the highest mobile data prices in the world.
Due to the high cost, Canadians are cautious with data usage, relying on WiFi, text, and call features.
The telecommunications industry in Canada required significant reforms.
High prices and concentrated market power caused ongoing discussions and regulatory efforts aimed at increasing competition and reducing consumer costs.
In 2023, the government pushed for more MVNO access.
In the same year, Canadian telecommunications services industry revenues amounted to 59.6 billion CAD.
European Telecommunications Industry
Europe has a vast and complex telecommunications industry across approximately 44 countries with numerous players in each country.
In addition to major players, smaller countries have their local mobile phone providers, making the market even more fragmented.
The leading European telecommunication operators:
- Deutsche Telekom 🇩🇪,
- Telefónica 🇪🇸,
- Vodafone 🇬🇧,
- Orange 🇫🇷,
- BT 🇬🇧,
- Telecom Italia 🇮🇹,
- Telenor 🇳🇴,
- Numericable-SFR 🇫🇷.
Deutsche Telekom is Europe’s telecom leader, with a presence in many European countries, including:

- Germany,
- Austria,
- Poland,
- Netherlands.
Telefónica is another major player in the European telecommunications market and one of the top telecom operators worldwide.
Primarily used among customers in Spain, where it is the largest telecommunications provider.
Vodafone is another top-rated telecom operator in Europe, especially famous in the UK.
Related read: Best MVNO Carriers in Europe (List)
Telecommunications Industry in UK
The United Kingdom’s telecommunications industry is highly competitive.
UK mobile market share by operator:
- Vodafone,
- British Telecommunications,
- Sky,
- 3 UK,
- O2.
Vodafone is the most valuable telecommunications brand in the UK with a brand value of 19.506 million USD.
UK’s active mobile subscriber base continues to grow steadily, reaching 97.2 million subscribers in 2021.
Related read: Best MVNO Carriers in the UK (List)
China Telecommunications Industry Overview
The Chinese telecommunications market is dominated by:
- China Mobile,
- China Telecom,
- China Unicom.
China is the world’s largest mobile market, with around 1.7 billion mobile subscribers.

| Year | China Mobile | China Unicom | China Telecom |
|---|---|---|---|
| 2017 | 887.20 M | 284.16 M | 249.96 M |
| 2018 | 925.07 M | 315 M | 303 M |
| 2019 | 950 M | 318 M | 336 M |
| 2020 | 942 M | 305.8 M | 351 M |
| 2021 | 956.89 M | 372 M | 317.1 M |
| 2022 | 975 M | 213 M | 391 M |
| 2023 | 794 M | 259.64 M | 407.77 M |
Source: Statista
China Mobile had 1.005 billion subscribers in 2025, making it the largest telecommunications company in China.
Related read: Best MVNO Carriers in Asia (List)
Telecommunications Industry in Africa, South Africa, and The Middle East
Africa’s telecom sector is expanding fast.
With 1.3 billion mobile subscriptions, connectivity is at an all-time high, and access to 4G, 5G, and fiber broadband is increasing.
More people are coming online than ever before.
South Africa leads the way with a highly developed telecom market.
Mobile penetration exceeds 100% with 108.42 million mobile subscriptions recorded in 2023.
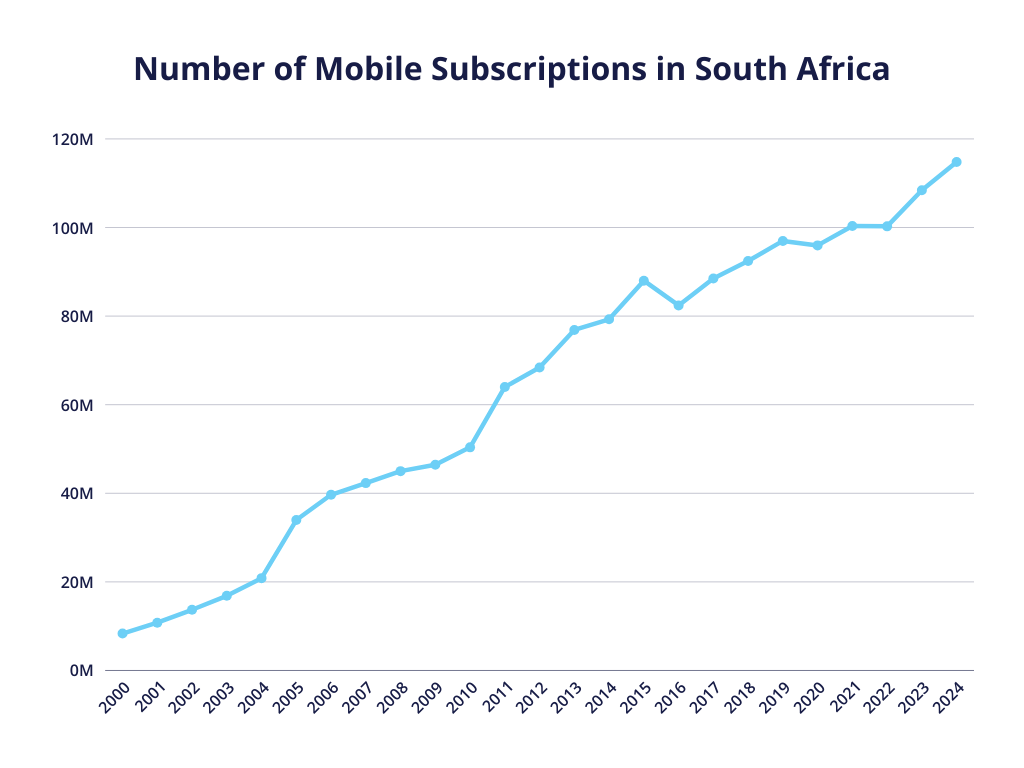
| Year | Mobile subscriptions |
|---|---|
| 2011 | 64 M |
| 2012 | 68.39 M |
| 2013 | 76.87 M |
| 2014 | 79.28 M |
| 2015 | 88 M |
| 2016 | 82.41 M |
| 2017 | 88.5 M |
| 2018 | 92.43 M |
| 2019 | 96.97 M |
| 2020 | 95.96 M |
| 2021 | 100.33 M |
| 2022 | 100.26 M |
| 2023 | 108.42 M |
| 2024 | 114.79 M |
Source: Statista
The major players shaping the telecommunications industry in South Africa are:
- MTN,
- Vodacom,
- Telkom.
The telecommunications market in South Africa is expected to reach $16.5 billion by the end of 2025.
Meanwhile, the Middle East is investing in next-generation telecom infrastructure.
Countries like Saudi Arabia and the UAE are expanding 5G networks and integrating AI and cloud technology to improve services.
By 2030, 5G is expected to account for half of all mobile connections in the Middle East.
The region is becoming a hub for telecom innovation.
The future of telecommunications in these regions looks promising.
Growth of Telecommunications Industry in India
The telecommunication market across India is the second largest in the world.
Mobile data there is affordable.
The biggest telecom companies in India:
- Bharti Airtel,
- Reliance Jio,
- Airtel.
There were around 1.16 billion mobile subscriptions in 2023 across India.
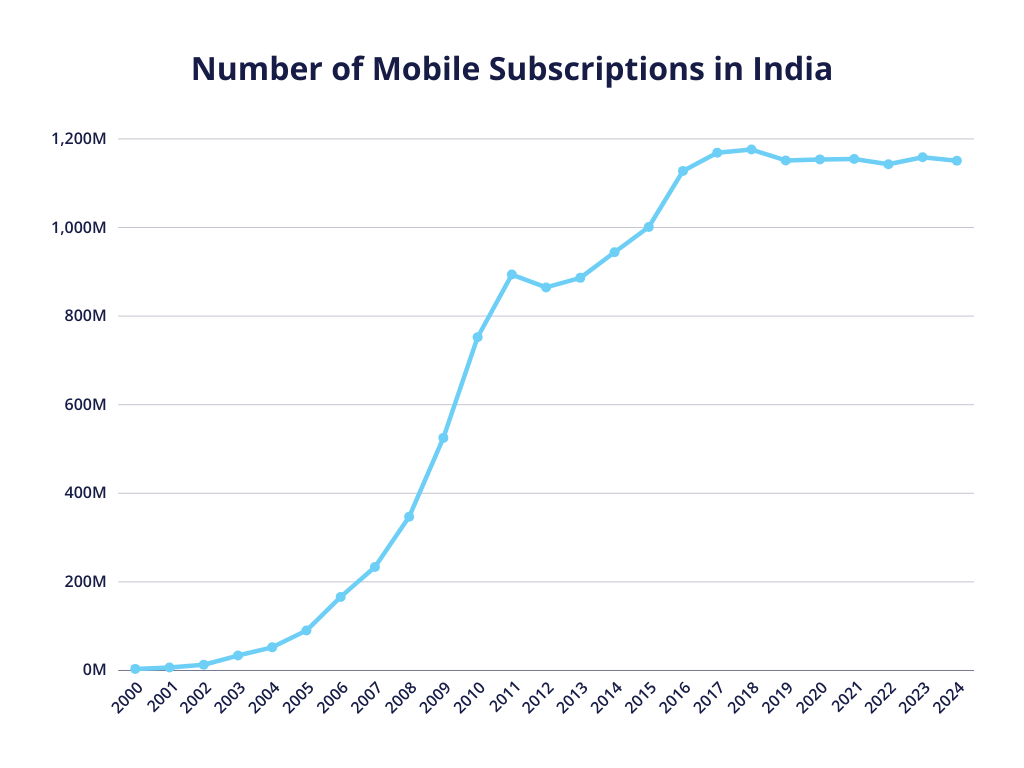
| Year | Mobile subscriptions |
|---|---|
| 2011 | 893.86 M |
| 2012 | 864.72 M |
| 2013 | 886.3 M |
| 2014 | 944.01 M |
| 2015 | 1001.06 M |
| 2016 | 1127.81 M |
| 2017 | 1168.9 M |
| 2018 | 1176.02 M |
| 2019 | 1151.44 M |
| 2020 | 1153.77 M |
| 2021 | 1154.62 M |
| 2022 | 1142.93 M |
| 2023 | 1158.49 M |
| 2024 | 1150.66 M |
Source: Statista
The average monthly data usage per subscriber in 2023 was 24.1 GB.
To put this in perspective – that’s almost 2x the amount of data used per month in 2020 (13.5 GB/mo).
Let’s look at the growth and revenue share of top telecommunication companies in India:
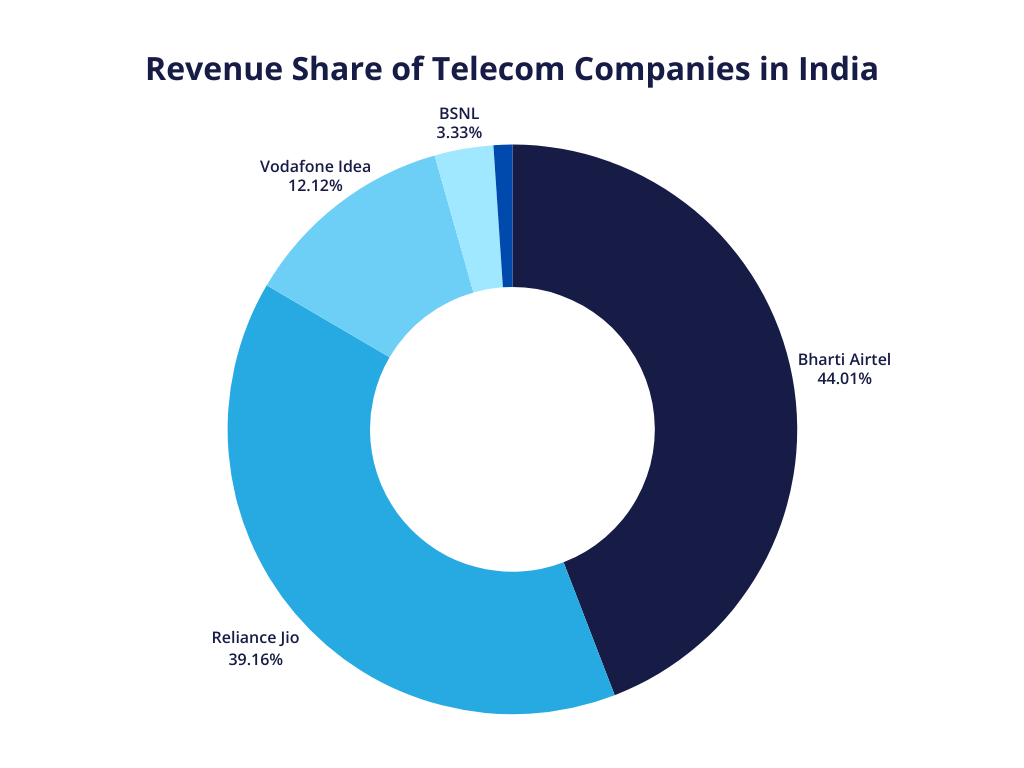
| Company | Revenue Share | Revenue (INR) | Revenue (USD) |
|---|---|---|---|
| Bharti Airtel | 44.01% | ₹1,115.51 B | $12.3 B |
| Reliance Jio | 39.16% | ₹992.4 B | $10.94 B |
| Vodafone Idea | 12.12% | ₹307.2 B | $3.39 B |
| BSNL | 3.33% | ₹84.35 B | $0.93 B |
| Tata | 1.06% | ₹26.8 B | $0.30 B |
| Other | 0.32% | ₹8.43 B | $0.09 B |
Source: Statista
Bharti Airtel is the leader in revenue, while Reliance Jio has a base of around 459.8 million subscribers in 2025, making it the largest telco in India by subscriber base.
Jio and Airtel are also one of the fastest-growing telecom companies in the world.
Australian Mobile Telecommunications Industry
Top telecom companies in Australia:
- Telstra,
- Optus,
- Vodafone.
Telstra has 43% of the market share for mobile phone services.
Australia telecom market share:
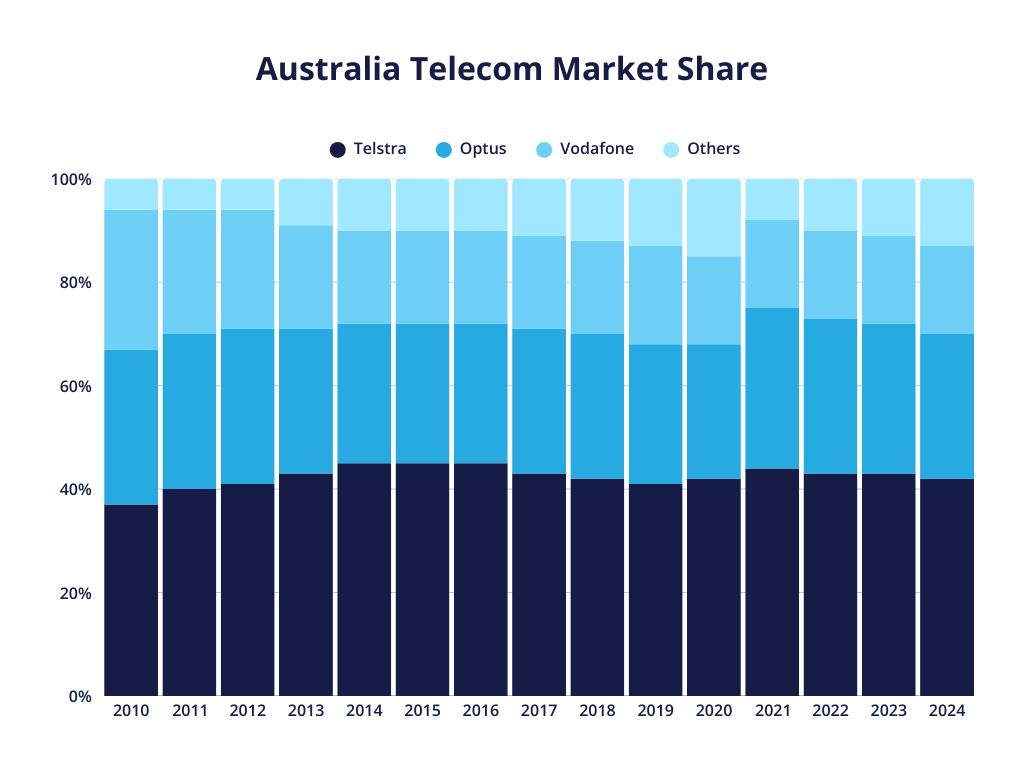
| Year | Telstra | Optus | Vodafone | Others |
|---|---|---|---|---|
| 2010 | 37% | 30% | 27% | 6% |
| 2011 | 40% | 30% | 24% | 6% |
| 2012 | 41% | 30% | 23% | 6% |
| 2013 | 43% | 28% | 20% | 9% |
| 2014 | 45% | 27% | 18% | 10% |
| 2015 | 45% | 27% | 18% | 10% |
| 2016 | 45% | 27% | 18% | 10% |
| 2017 | 43% | 28% | 18% | 11% |
| 2018 | 42% | 28% | 18% | 12% |
| 2019 | 41% | 27% | 19% | 13% |
| 2020 | 42% | 26% | 17% | 15% |
| 2021 | 44% | 31% | 17% | 8% |
| 2022 | 43% | 30% | 17% | 10% |
| 2023 | 43% | 29% | 17% | 11% |
| 2024 | 42% | 28% | 17% | 13% |
Source: Statista
There were a total of 31.89 million mobile subscriptions in Australia reported for 2022.
Related read: Best MVNO Carriers in Australia and New Zealand (List)
How is the Telecommunications Industry changing in 2026?
In 2026, the telecommunications industry is shifting from network rollout to monetization, efficiency, and service differentiation.
With 5G coverage largely established in many markets, operators are focusing on extracting more value from existing infrastructure while preparing for the next technology cycle.
Enterprise and B2B services are becoming a key growth driver. As consumer markets mature, telecom providers are expanding into private 5G, edge computing, cloud, and managed connectivity services for industries such as manufacturing, logistics, energy, and smart cities.
AI is increasingly embedded across telecom operations. In 2026, AI is used for network automation, traffic optimization, predictive maintenance, fraud detection, and customer support, helping operators reduce costs and improve service quality.
Looking ahead, 2026 also marks a period of intensified 6G research and standardization, alongside a stronger industry focus on sustainability, energy efficiency, and long term operational resilience.
So, what are your thoughts? Let us know in the comments below.