Insights
Learn how to use the Insights feature to understand your charging behavior, track your environmental impact, and optimize your charging routines.
Understanding Your Charging Habits
The Insights feature in the EV Charge app helps you understand your charging patterns and make smarter decisions about when and where to charge your electric vehicle.
With Insights, you can:
- See total charging time — view the total minutes spent charging.
- View energy consumed (kWh) — total amount of electricity used.
- View average cost per kWh — average rate paid during the period.
- See total amount spent — sum of all charging costs.
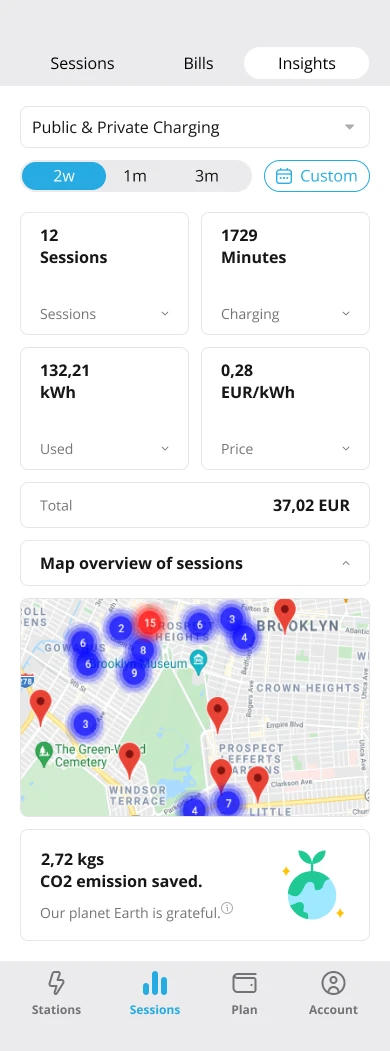
- View map overview of sessions — visualize where charging sessions occurred (clustered and individual points).
How to View Your Charging Insights
- Go to Insights: From the main menu, tap on the Insights icon.
- Filter Your Data: You can view data from the last 14, 30, or 90 days, or select a custom date range.
- Explore the Visuals: The app displays your charging data in easy-to-read charts and graphs. For example, you can see a bar chart showing your number of charging sessions per day or a line chart of the energy you’ve consumed over time.
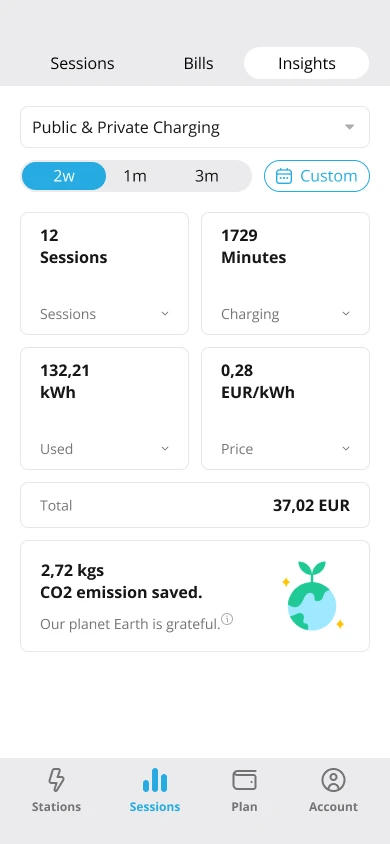
Tracking Your Environmental Impact
The EV Charge app also allows you to see the positive impact you’re making by driving an electric vehicle. The Environmental Impact section shows you how much CO₂ you’ve saved compared to driving a traditional diesel car.
How to Check Your CO₂ Savings
- Open Insights: Tap on the Insights icon in the app.
- View Your Savings: The app calculates and displays your total CO₂ savings in kilograms. This is based on the distance you’ve traveled (inferred from your charging sessions) and the average emissions of a diesel vehicle.
- Track Over Time: You can see your cumulative CO₂ reductions on a monthly or yearly basis.
Analyzing Your Usage Trends
The Usage Trends section provides a detailed history of your charging sessions. You can analyze your charging behavior over time to identify patterns and opportunities for optimization.
How to Analyze Your Usage
- Navigate to Insights: Open the Insights section of the app.
- Set a Timeframe: Select the period you want to analyze (e.g., past 30 days).
- View Detailed Graphs: The app presents your data in various formats, such as:
- Bar Charts: Show the number of charging sessions per day or week.
- Line Charts: Illustrate the amount of energy consumed over time.
- Heat Maps: Visualize the intensity of your charging sessions on different days or weeks.